

Click image
for larger version
Total
industrial
production (IP) edged up 0.1% in February (+0.4% expected)
after decreasing 0.4% in January (originally -0.6%). Manufacturing production
fell 0.4% in February for its second consecutive monthly decline. The index for
utilities rose 3.7%, while the index for mining moved up 0.3%. At 109.7% of its
2012 average, total industrial production was 3.5% higher in February than it
was a year earlier.

Click image
for larger version

Click image
for larger version
Industry Groups
Manufacturing
output decreased 0.4% in February after falling 0.5% in January. In February,
the index stood 1.0% above its year-earlier level (NAICS manufacturing: -0.4% MoM; +1.2%YoY). The output of durables
edged down. Losses of 1½% or more were registered by nonmetallic mineral
products, by machinery, and by furniture and related products, while gains of
more than 1% were registered by computer and electronics products, by aerospace
and miscellaneous transportation equipment, and by miscellaneous manufacturing (wood products: +0.8%). Nondurable goods
production fell 0.7%. Most major nondurable goods industries posted decreases;
the only increases were recorded by paper
products (+0.7%) and by food,
beverage, and tobacco products. Production of other manufacturing (publishing
and logging) increased 0.5% but remained well below its year-earlier level.
The
output of utilities rose 3.7% in February; the output of electric utilities
rebounded from decreases in the previous two months. Mining output moved up 0.3%
for its 13th consecutive monthly increase, and the index was 12.5% above its
level of a year earlier.

Click image
for larger version
Capacity
utilization (CU) for the industrial sector edged down less than 0.1 percentage
point (PP) in February to 78.2%, a rate that is 1.6PP below its long-run
(1972–2018) average.
Manufacturing
CU declined 0.4PP in February to 75.4%, almost 3PP below its long-run average,
with losses for durables and for nondurables (NAICS manufacturing: -0.5%, to 76.0%; wood products: +0.6%, to 75.4%; paper products: +0.7%, to 87.0%)
but a gain for other manufacturing (publishing and logging). The utilization
rate for mining decreased to 94.6% but remained well above its long-run average
of 87.1%. The rate for utilities jumped to 78.6%, but it was still nearly 7PP
below its long-run average.
Click image
for larger version
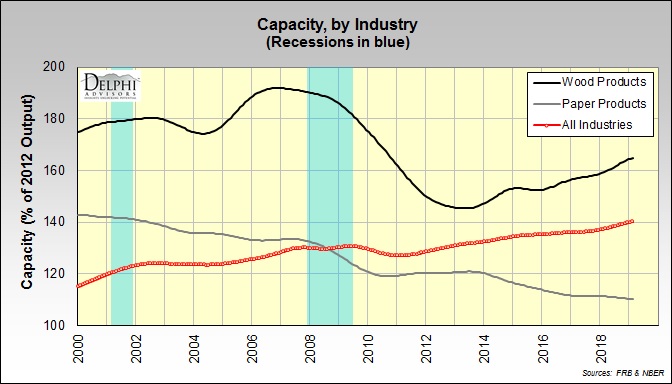
Capacity
at the all-industries level nudged up 0.2% (+2.2 % YoY) to 140.2% of 2012
output. Manufacturing (NAICS basis) rose fractionally (+0.1% MoM; +1.5% YoY) to
139.4%. Wood products: +0.2% (+3.4%
YoY) to 164.6%; paper products: -0.1%
(-1.0 % YoY) to 110.2%.
The foregoing comments represent the
general economic views and analysis of Delphi Advisors, and are provided solely
for the purpose of information, instruction and discourse. They do not constitute
a solicitation or recommendation regarding any investment.
No comments:
Post a Comment
Note: Only a member of this blog may post a comment.