
Click image
for larger version
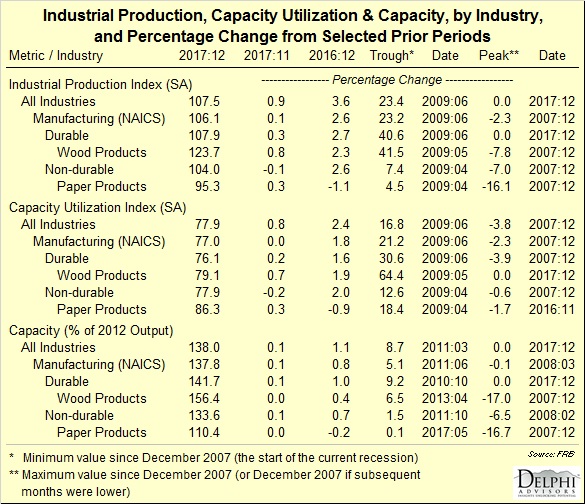
Total
industrial
production (IP) rose 0.9% in December (+0.4% expected)
despite manufacturing output edging up by only 0.1% (+0.3% expected). Revisions
to mining and utilities altered the pattern of growth for October and November,
but the level of the overall index in November was little changed. For 4Q as a
whole, total IP jumped 8.2% at an annual rate after being held down in 3Q by
Hurricanes Harvey and Irma. At 107.5% of its 2012 average, the index has
increased 3.6% since December 2016 for its largest calendar-year gain since
2010. The gain in manufacturing output in December was its fourth consecutive
monthly increase. The output of utilities advanced 5.6% for the month, while
the index for mining moved up 1.6%.

Click image
for larger version

Click image
for larger version
Industry Groups
In
December, manufacturing output edged up 0.1% and was 2.4% above its
year-earlier level. In 4Q, the index for manufacturing moved up at an annual
rate of 7.0%. The gain in manufacturing in December reflected increases of 0.3%
and 0.2% in the indexes for durables and for other manufacturing (publishing
and logging), respectively; the index for nondurables edged down 0.1%. Within
durables, gains were widespread, with the largest advance, 2.0%, registered by
motor vehicles and parts (wood products:
+0.8%). Among nondurables, increases for most major industries were offset
by declines in petroleum and coal products, in chemicals, and in plastics and
rubber products (paper products: +0.3%).
The
output of mines rose 1.6% in December primarily because of a gain posted by oil
and gas extraction; the index was up 11.5% from its year-earlier level. In 4Q, mining output advanced at an annual rate of 12.7% after being
held down by the hurricanes in 3Q.

Click image
for larger version
Capacity
utilization (CU) for the industrial sector was 77.9%, a rate that is 2.0
percentage points below its long-run (1972–2016) average.
Capacity
utilization in manufacturing was unchanged at 76.4% in December and remained
2.0 percentage points below its long-run average. Utilization for durables
edged up 0.1 percentage point to 76.1%, and the operating rate for nondurables
edged down 0.1 percentage point to 77.9% (wood
products: +0.7%; paper products: +0.3%).
The operating rate for mines rose 1.2 percentage points to 85.6%, and the rate
for utilities jumped 4.2 percentage points to 80.4%.

Click image
for larger version
Capacity
at the all-industries level nudged up 0.1% (+1.1% YoY) to 138.0% of 2012
output. Manufacturing (NAICS basis) rose fractionally (+0.1% MoM; +0.8% YoY) to
137.8%. Wood products: +0.0% (+0.4%
YoY) to 156.4%; paper products: 0.0%
(-0.2% YoY) to 110.4%.
The foregoing comments represent the
general economic views and analysis of Delphi Advisors, and are provided solely
for the purpose of information, instruction and discourse. They do not
constitute a solicitation or recommendation regarding any investment.


No comments:
Post a Comment
Note: Only a member of this blog may post a comment.