What is Macro Pulse?

Macro Pulse highlights recent activity and events expected to affect the U.S. economy over the next 24 months. While the review is of the entire U.S. economy its particular focus is on developments affecting the Forest Products industry. Everyone with a stake in any level of the sector can benefit from
Macro Pulse's timely yet in-depth coverage.


Thursday, December 2, 2010

November 2010 Currency Exchange Rates

Click image for larger view

The U.S. dollar recaptured some of the ground given up during October, appreciating in November against two of the three currencies we track. The greenback gained 1.7 percent against the euro and 0.9 percent against the yen, but extended its weakening trend against Canada’s loonie (losing 0.5 percent). On a trade-weighted index basis, the dollar appreciated 0.3 percent against a basket of 26 currencies.
 
Click image for larger view

Canada: Although Canadian gross domestic product (GDP) shrank by 0.1 percent in September and 3Q2010 exports fell by 1.3 percent after a year of gains, interest rate differentials (especially against the United States) and burgeoning softwood lumber exports to China allowed the loonie to strengthen against the greenback.

Europe: Given the upheavals caused by renewed concerns over public debt crises in Europe, it is somewhat surprising that the euro’s value suffered as little damage as it did in November. Germany’s chancellor, Angela Merkel, was unusually blunt when admitting that the euro is in an “exceptionally serious” situation because of:

* A doubling in Greece’s deficit;

* Ireland’s reluctance to accept conditions of a bailout, and PIMCO CEO El-Erian’s advice to “take your money out” of Irish banks;

* Fears that Ireland’s problems could spread to Spain and Portugal;

* The absence of a government amid ethnic strife in Belgium.

Indeed, the escalating debt crisis on the Eurozone periphery may be starting to contaminate the creditworthiness of Germany and other core states of the monetary union. "Germany cannot keep paying for bail-outs without going bankrupt itself," said Professor Wilhelm Hankel, of Frankfurt University. That refrain was picked up by German Finance Minister Wolfgang Schäuble. "We're not swimming in money, we're drowning in debts," he told the Bundestag.

Japan: Bits of encouraging economic news (e.g., accelerating GDP growth during the July-September quarter) were overshadowed by indications those improvements will prove temporary, and realization that China has overtaken Japan as the world’s second-largest economy. "Our economy is stalling as output is weakening," said Minister of State for Economic and Fiscal Policy Banri Kaieda. Also, as MarketWatch analyst Lisa Twaronite pointed out, Japan’s reputation as a “safe haven” is relative; all of Japan’s major cities are within range of North Korea’s missiles. Understandably, then, the yen sold off sharply against the dollar on November 23 when North and South Korea exchanged artillery fire. The currency also dropped on news of yet another $60 billion stimulus package designed to stimulate the country’s economy.

Sunday, November 28, 2010

September 2010 International Trade

Click image for larger view

According to data compiled by the Netherlands Bureau for Economic Policy Analysis, the volume of world trade declined by 0.6 percent in September, on the heels of a downwardly revised 1.4 percent (originally 1.5 percent) increase in August. World trade increased by 0.9 percent in 3Q2010 when compared to the previous quarter, the lowest quarterly gain since 2Q2009.

Import volumes declined both in advanced and emerging economies, the major exception being Latin America, where imports continued to grow strongly. Imports fell most heavily in the Euro Area. The only regions that achieved positive export growth were Latin America and Central and Eastern Europe, the latter doing remarkably well after having experienced several months of declines.

Although the growth in global demand appears to be slowing, prices have not yet fallen by an appreciable degree; in fact prices moved higher (by nearly 0.7 percent) for a third consecutive month in September.
 
Click image for larger view

Turning to the United States, total September exports of $154.1 billion and imports of $198.1 billion resulted in a goods and services deficit of $44.0 billion, down from $46.5 billion in August (revised up from $46.3 billion). September exports were $0.5 billion more than August exports of $153.6 billion while imports were $2.0 billion less than August imports of $200.1 billion.
 
Click image for larger view

The trade slowdown appears to be affecting the U.S. paper exports. Exports of wood pulp, paper and paperboard retreated by 139,000 metric tons (4.6 percent) in September. At the same time, imports rose by 43,000 tons (11.4 percent). Despite the retreat, exports remained well above year-earlier levels.
 
Click image for larger view

Softwood lumber exports ticked up by 7 million board feet, while imports declined by virtually the same amount. Exports are 54.3 percent higher than year-earlier levels, but imports are down by only 1.9 percent.
 
Click image for larger view

With the U.S. dollar weakening in October by nearly 3 percent against a basket of 26 currencies, we would not be surprised to see the October trade deficit widen. Although there is considerable monthly “noise” in the relationship between the dollar’s value and the magnitude of the trade deficit, in broad terms the deficit widens when the dollar depreciates. Conversely, the deficit narrows when the dollar appreciates.

Friday, November 26, 2010

3Q2010 Gross Domestic Product: Second Estimate

Click image for larger version

The Bureau of Economic Analysis (BEA) reported that the rate of growth in real U.S. gross domestic product (GDP) accelerated more in 3Q2010 than originally estimated. The U.S. economy expanded at a 2.5 percent annual rate (the original estimate was 2.0 percent), up from 1.7 percent in the previous quarter.
 
Click image for larger version

The BEA’s revisions showed bigger gains in exports, consumer spending and business investment in new equipment than previously estimated. However, David Rosenberg, chief economist at Gluskin Sheff, provided some counterbalance to the seemingly “positive” 3Q GDP revisions:

“While the upward revision to 3Q GDP was impressive and broad-based, the monthly data on GDP reveal a sharp deceleration. For example, over the three months to September (point-to-point as opposed to quarterly averages), real GDP actually slowed to a 1.0 percent annual rate -- down from 1.7 percent in July, 2.6 percent in June and 4.6 percent at the turn of the year. Based on information at hand, it looks as though 4Q real GDP is coming in closer to a 1.7 percent annual rate, so the moderation in overall economic activity will be more evident this quarter than it was in Q3 (sometimes quarterly averages masks what the true momentum really is).

“Heading into the second year of a recovery, [we should expect to see] a 5 percent-growth economy that is accelerating; not a 1 to 2 percent-growth economy that is rife with downside risks. To be sure, corporate profits have been terrific, but not due to any meaningful increase in top-line pricing power. Fully 96 percent of the rebound in output since the recession ended has been due to productivity growth -- talk about a miracle, especially since there has been no capital deepening now for about a decade. Productivity leads to income growth, but when the U6 unemployment rate is 17 percent (which means dramatic excess capacity in the jobs market), that income accrues to capital, not to labor.

“Compensation per hour is declining and unit labor costs have fallen nearly 2 percent in the past year, which has been a major underpinning for profit margins, to be sure. How long the productivity miracle can last is anyone's guess, but the excess slack in the labor market will linger on. What kept the consumer alive through all this was the massive help from Uncle Sam, but that is now coming to an end, which in turn will have some negative impact on domestic demand and revenue growth for the business sector. So, the combination of strong ex-U.S. growth and sustained solid productivity gains are going to be needed more than ever in order for the string of profits-surpassing-expectations to be extended into 2011.”

Thursday, November 18, 2010

October 2010 Consumer and Producer Price Indices

Click image for larger version

The seasonally adjusted Consumer Price Index for All Urban Consumers (CPI-U) increased 0.2 percent in October. Over the last 12 months, the all items index increased 1.2 percent. As has frequently been the case in recent months, an increase in the energy index was the major factor in the all items seasonally adjusted increase. The gasoline index rose for the fourth month in a row and accounted for almost 90 percent of the all items increase; the household energy index rose as well.

The food index rose slightly, while the index for all items less food and energy was unchanged -- the third month in a row with no change. The indexes for shelter and medical care rose, but these increases were offset by declines in an array of indexes including new vehicles, used cars and trucks, apparel, recreation, and tobacco.

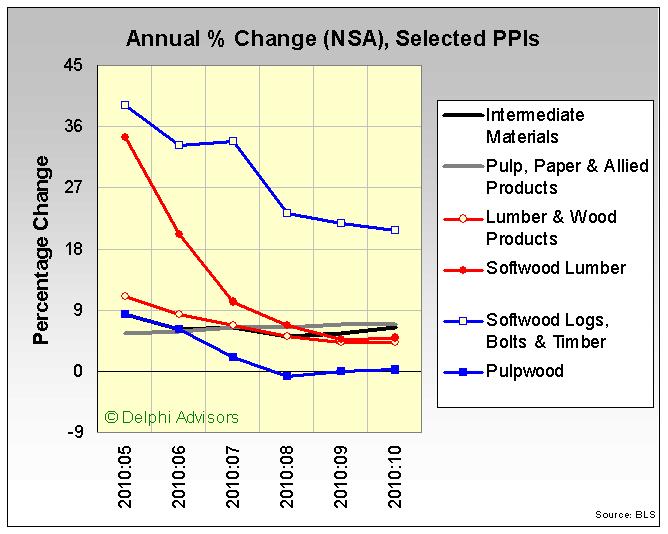
The seasonally adjusted Producer Price Index for Finished Goods (PPI) increased 0.4 percent in October. This advance followed a 0.4 percent rise in both September and August. At the earlier stages of processing, prices received by manufacturers of intermediate goods moved up 1.2 percent in October, and the crude goods index increased 4.3 percent. On an unadjusted basis, prices for finished goods advanced 4.3 percent for the 12 months ended October 2010, their largest year-over-year gain since a 5.1 percent rise in May 2010.
 
Click image for larger version

Details at different stages of processing include:

Finished goods -- The increase in the index for finished goods can be traced to prices for finished energy goods, which moved up 3.7 percent. By contrast, the indexes for both finished goods less foods and energy and for finished consumer foods decreased, falling 0.6 percent and 0.1 percent, respectively.

Intermediate goods -- This index increased 1.2 percent in October, its third straight monthly advance. The October rise in the intermediate goods index was broad based, with energy prices climbing 3.2 percent; the index for intermediate materials less foods and energy increased 0.6 percent, and prices for foods and feeds moved up 1.3 percent. On a 12-month basis, the index for intermediate goods climbed 6.4 percent in October, its eleventh consecutive year-over-year increase.

Crude goods -- The crude-goods index rose 4.3 percent in October. For the three months that ended in October, crude goods prices increased 6.2 percent. In October, nearly half of the monthly advance is attributable to the index for crude energy materials, which climbed 5.4 percent. Also contributing to the broad-based rise in crude goods prices, the indexes for crude foodstuffs and feedstuffs and for crude nonfood materials less energy moved up 4.2 percent and 2.1 percent, respectively.
 
Click image for larger version

In the case of forest products sector PPIs that we track, most indices appear to be either in the process of breaking off their earlier declines, or are beginning/continuing to move higher. Prices are all higher than year-earlier levels, although the rate of growth has slowed in several cases.
 
Click image for larger version

Click image for larger version

October 2010 Industrial Production, Capacity Utilization and Capacity

Click image for larger version

Industrial production was unchanged in October after having fallen 0.2 percent in September. Manufacturing output gained 0.5 percent in October. Factory production in September was initially reported to have decreased 0.2 percent, but incoming data on steel, fabricated metal products, machinery, and chemicals resulted in a revision to +0.1 percent. At 93.4 percent of its 2007 average, total industrial production in October was 5.3 percent above its year-earlier level.

Click image for larger version

Industrial production among forest products manufacturers increased in October; Wood Products gained 2.5 percent while Paper rose by 0.6 percent.
 
Click image for larger version

October’s all-industry capacity utilization rate was flat at 74.8 percent, a rate 6.6 percentage points (9.7 percent) above the low in June 2009 and 5.8 percentage points below its average from 1972 to 2009. Forest products manufacturing capacity utilization rose for both sectors: 3.1 percent for Wood Products and 0.8 percent for Paper.
 
Click image for larger version

Capacity at the all-industries level was flat in October, but fell in both Wood Products and Paper sectors.

October 2010 U.S. Treasury Statement and September TIC Flows

Click image for larger version

U.S. fiscal year 2011 started out with federal outlays of $286.4 billion and receipts of $146.0 billion in October, resulting in a $140.4 billion federal budget deficit.
 
Click image for larger version

The shortfall between receipts and outlays has to be made up from somewhere, and borrowing from overseas is one of the main ways of accomplishing that. According to the Treasury International Capital (TIC) accounting system, net foreign inflows jumped to nearly $81.7 billion in September (from $11.2 billion in August), which helped pull the most recent three-month average rate up to the $57.6 billion mark. While September’s increase is encouraging, the three-month average is still below the $70 billion per month typical of the period between January 2002 and August 2007 (the date of the first financial scare).
 
Click image for larger version

In September foreigners sold $24.9 billion more of short-term securities (e.g., Treasury bills) than they bought, dropping the three-month average net inflows for that category to just shy of $6.0 billion.
 
Click image for larger version

At the same time, however, they purchased more ($91.4 billion) long-term debt. Net inflows into long-term public debt (e.g., Treasury bonds) rose by another $70.1 billion in September (down from $121.8 billion in August), bringing the three-month average rate to $79.7 billion. Flows into private equities grew by $21.3 billion in September, bringing the three-month average to $20.9 billion.
 
Click image for larger version

The amount of U.S. public debt held by foreigners continued its march upward in September. Japan purchased the most ($28.4 billion), followed by China ($15.1 billion); the Caribbean banking centers shed $15 billion.

Central banks hold the “lion’s share” of Treasury securities, although the private sector has become much more active during the past several months. Private holdings have increased by more than 68 percent during the past year and now represent over one-third of total foreign holdings of Treasury debt.
 
Click image for larger version

What these charts do not indicate, since they are oriented toward inflows of foreign money, is that the Federal Reserve is now the second largest owner of U.S. Treasuries. The Fed overtook Japan earlier in October, leaving China as the only country with greater ownership of U.S. debt. Since the Fed is “monetizing” that debt (i.e., “printing” money to buy Treasuries), we believe inflation could become much more of an issue as time progresses.

Wednesday, November 17, 2010

November 2010 Macro Pulse - Cassandras of the Double Dip

For those whose memory of Greek mythology is at best a bit foggy, Cassandra was a prophetess who was cursed so that her predictions - though correct - were never believed. Our prediction since 2H2008 of another recession to follow fairly closely on the heels of the one that officially ended in June 2009 has not always been well received. In October, Ed Leamer, director of the UCLA Anderson Forecast, even coined the pejorative “Cassandras of the double dip” to describe those like us who expect a second downturn. Obviously the jury is still out on whether our view or some other more-optimistic alternative will be vindicated and thus should have been believed, but our reading of the last month’s economic “tea leaves” gives us little reason to change our forecast.

For example,....

Click here to read the entire November 2010 Macro Pulse.


The Macro Pulse blog is a commentary about recent economic developments that affect the forest products industry. That commentary provides context for our 24-month forecast, which is contained in the monthly Economic Outlook newsletter available through Forest2Market. The monthly Macro Pulse newsletter summarizes and gives a convenient point of access to the previous 30 days of commentary available on this website.