What is Macro Pulse?

Macro Pulse highlights recent activity and events expected to affect the U.S. economy over the next 24 months. While the review is of the entire U.S. economy its particular focus is on developments affecting the Forest Products industry. Everyone with a stake in any level of the sector can benefit from
Macro Pulse's timely yet in-depth coverage.


Wednesday, October 30, 2013

September 2013 U.S. Home Sales, Inventory and Prices

Click image for larger view
Because the Census Bureau is delaying the release of September’s new residential sales data until December 4 (when it will be combined with October’s data), this post will contain references to just existing home sales and prices.
Existing home sales decreased (by 100,000 units or 1.9 percent) to 5.29 million units (SAAR) in September. The median price of previously owned homes sold in September dropped by $10,500 or 5.0 percent), to $199,200. The number of existing homes for sale remained stable but months of inventory increased by 0.1 month. 
Click image for larger view
Although the median price of existing homes for sale fell slightly in August ($800 lower than in July), housing affordability continued to erode because of rising mortgage interest rates and stagnant median family incomes. Concurrently, Standard & Poor’s reported that both the 10- and 20-City Composites in the S&P/Case-Shiller Home Price indices posted not-seasonally adjusted monthly gains of 1.3 percent in August (12.8 percent relative to a year earlier). Dallas, TX and Denver, CO continue to be the only cities that have surpassed their pre-recessionary price peaks. 
Click image for larger view
The foregoing comments represent the general economic views and analysis of Delphi Advisors, and are provided solely for the purpose of information, instruction and discourse. They do not constitute a solicitation or recommendation regarding any investment.

September 2013 Residential Permits, Starts and Completions

Because the Census Bureau is delaying the release of September’s new residential construction data until November 26 (to be combined with October data), we have nothing to report at this time.

The foregoing comments represent the general economic views and analysis of Delphi Advisors, and are provided solely for the purpose of information, instruction and discourse. They do not constitute a solicitation or recommendation regarding any investment.

September 2013 Consumer and Producer Price Indices (incl. Forest Products)

Click image for larger version
The seasonally adjusted Consumer Price Index for All Urban Consumers (CPI-U) increased 0.2 percent in September. Over the last 12 months, the all-items index increased 1.2 percent -- the smallest annual increase since April. The energy index rose 0.8 percent in September and accounted for about half of the seasonally adjusted all-items increase. All the major energy component indexes rose in September. The food index was unchanged, with declines in the indexes for fruits and vegetables and for nonalcoholic beverages offsetting increases in other indexes.
The seasonally adjusted Producer Price Index for finished goods (PPI) fell 0.1 percent in September. Prices for finished goods rose 0.3 percent in August and were unchanged in July. At the earlier stages of processing, prices received by producers of intermediate goods advanced 0.1 percent, and the crude goods index increased 0.5 percent. On an unadjusted basis, prices for finished goods moved up 0.3 percent for the 12 months ended September 2013, the lowest 12-month change since a 2.0 percent decline in October 2009. 
Click image for larger version
All of the price indices we track either were unchanged or rose (especially Softwood Lumber) in September. Wood Fiber and Pulp, Paper & Allied Products once again achieved new all-time highs. 
Click image for larger version
The foregoing comments represent the general economic views and analysis of Delphi Advisors, and are provided solely for the purpose of information, instruction and discourse. They do not constitute a solicitation or recommendation regarding any investment.

Tuesday, October 29, 2013

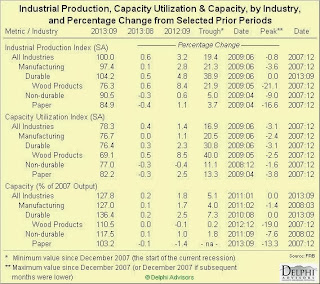
September 2013 Industrial Production, Capacity Utilization and Capacity

Click image for larger version
Industrial production (IP) increased 0.6 percent in September (thanks primarily to a 4.4 percent gain in the output of utilities) following a gain of 0.4 percent in August; September’s overall gain was better than expectations of 0.4 percent. For 3Q2013 as a whole, industrial production rose at an annual rate of 2.3 percent. Manufacturing output edged up 0.1 percent in September following a gain of 0.5 percent in August, and increased at an annual rate of 1.2 percent for 3Q. The level of the index for total industrial production in September was equal to its 2007 average and was 3.2 percent above its year-earlier level. Wood Products output rose by 0.6 percent while Paper shrank by 0.4 percent. 
Click image for larger version 
Click image for larger version
Capacity utilization for total industry moved up 0.4 percentage point to 78.3 percent in September, a rate 1.9 percentage points below its long-run (1972-2012) average. Wood Products capacity utilization rose by 1.7 percent while Paper decreased by 1.1 percent. 
Click image for larger version
Capacity at the all-industries and manufacturing levels moved, respectively, 0.2 and 0.1 percent higher. By contrast, Wood Products remained unchanged while Paper contracted by 0.1 percent.
The foregoing comments represent the general economic views and analysis of Delphi Advisors, and are provided solely for the purpose of information, instruction and discourse. They do not constitute a solicitation or recommendation regarding any investment.

Monday, October 28, 2013

August 2013 International Trade (Softwood Lumber)

Click image for larger view
Softwood lumber exports rose by 3 MMBF (2.1 percent) in August while imports decreased by 147 MMBF (14.2 percent). Exports were 24 MMBF (19.4 percent) above year-earlier levels; imports were 3 MMBF (0.3 percent) higher. 
Click image for larger view
Asia (especially China and Japan) retained the “top spot” for U.S. softwood lumber exports in August. China was the largest single-country destination. Meanwhile, Canada was far-and-away the largest source of softwood lumber imports into the United States. Imports from Romania, Austria, Estonia, Sweden and Malaysia have increased markedly on both year-over-year and year-to-date change bases. 
Click image for larger view 
Click image for larger view
Just over half of U.S. softwood lumber exports left the country through West Coast (primarily Seattle, WA) customs districts in August. At the same time, Great Lakes customs districts (especially Duluth, MN) handled most of the softwood lumber imports coming into the United States
Click image for larger view 
Click image for larger view
Douglas-fir made up just under one-quarter of all softwood lumber exports in August, followed by southern yellow pine. Hem-fir exports have jumped on a YTD basis, causing that species’ ranking to rise from 12th to 7th.
The foregoing comments represent the general economic views and analysis of Delphi Advisors, and are provided solely for the purpose of information, instruction and discourse. They do not constitute a solicitation or recommendation regarding any investment.

Sunday, October 27, 2013

August 2013 International Trade (General)

Click image for larger view
Total August exports of $189.2 billion and imports of $228.0 billion resulted in a goods and services deficit of $38.8 billion, up from $38.6 billion in July. August exports were $0.1 billion less than July exports of $189.3 billion. August imports were virtually unchanged at $228.0 billion. 
Click image for larger view
On a global scale, data compiled by the Netherlands Bureau for Economic Policy Analysis showed that world trade volume decreased by 0.8 percent in August while prices rose by 0.8 percent.
The foregoing comments represent the general economic views and analysis of Delphi Advisors, and are provided solely for the purpose of information, instruction and discourse. They do not constitute a solicitation or recommendation regarding any investment.

Wednesday, October 23, 2013

August 2013 U.S. Construction

Click image for larger view
Overall construction spending in the United States increased by 0.6 percent during August, to a seasonally adjusted and annualized rate (SAAR) of $915.1 billion, thanks to 1.2 and 0.4 percent advances in, respectively, private residential and public construction spending.
Click image for larger view
Click here for a discussion of August’s new residential permits, starts and completions. Click here for a discussion of new and existing home sales, inventory and prices.
The foregoing comments represent the general economic views and analysis of Delphi Advisors, and are provided solely for the purpose of information, instruction and discourse. They do not constitute a solicitation or recommendation regarding any investment.

Saturday, October 12, 2013

October 2013 Macro Pulse -- Grass Gets Trampled When Elephants Fight

We typically leave politics out of this publication, but the current wrangling in Washington, D.C. is difficult to ignore. Moreover, how the situation is ultimately resolved will profoundly affect the country’s future economic trajectory. The ongoing brinksmanship brings to mind the African proverb that “when two elephants fight, it is the grass that gets trampled.” The best we “grass” can hope for is a speedy resolution that does the least damage to the country’s fiscal condition and economic freedom.
Several federal agencies we rely on for data closed as funding dried up at the onset of the new fiscal year. With one or two exceptions, however, we were able to obtain the information we normally need to write this report. Some developments from September follow:
Click here to read the entire October 2013 Macro Pulse recap.
The Macro Pulse blog is a commentary about recent economic developments affecting the forest products industry. The monthly Macro Pulse newsletter summarizes the previous 30 days of commentary available on this website.

Sunday, October 6, 2013

September 2013 ISM Reports

Click image for larger version
More manufacturing businesses surveyed by the Institute for Supply Management (ISM) indicated their activity expanded in September than any month since June 2011. The PMI rose to 56.2 percent, an increase of 0.5 percentage point from August's reading of 55.7 percent (50 percent is the breakpoint between contraction and expansion); expectations had been for a drop to 55.0 percent. “Comments from the panel are generally positive and optimistic about increasing demand and improving business conditions,” said Bradley Holcomb, chair of ISM’s Manufacturing Business Survey Committee.
Click image for larger version
Despite the upbeat headline number, several sub-indices were not quite as positive as in August. New, export and import orders all expanded more slowly, for example. Also, a much larger number of respondents indicated they paid higher input prices in September. Employment expanded noticeably, however, which is likely what contributed most to the PMI uptick.
Details were mixed for the two manufacturing industries we track. Domestic Wood Products manufacturers saw their inventories shrink while new export orders rose; also, more businesses added employees, but the industry saw input prices rise as well. "Raw materials shortages continue,” wrote one Wood Products respondent, adding: “General trends are up, which enhances shortage issues." Paper Products manufacturers boosted production and employment in the face of higher new orders and order backlogs, as well as diminishing inventories.
Growth in the service sector slowed dramatically in September. The non-manufacturing index (now known simply as the “NMI”) registered 54.4 percent, 4.2 percentage points lower than August’s 58.6 percent. The index dropped to its lowest point since May, constituting the biggest one-month decline since March 2009. “The majority of the respondents' comments continue to be positive,” said Anthony Nieves, chair of ISM’s Non-Manufacturing Business Survey Committee. “However, there is an increase in the degree of uncertainty regarding the future business climate and the direction of the economy." 
Click image for larger version
Overall activity expanded among the service industries we track. The main negatives were shrinking employment and higher inventories. One Construction respondent warned that "Overall business conditions are slowing -- small manpower decrease of 5 percent."
Commodities up in price included diesel fuel, caustic soda and corrugated boxes. Gasoline and lumber (pine, plywood products and treated) were down in price.
The foregoing comments represent the general economic views and analysis of Delphi Advisors, and are provided solely for the purpose of information, instruction and discourse. They do not constitute a solicitation or recommendation regarding any investment.
Tuesday, October 1, 2013

September 2013 Monthly Average Crude Oil Price

Click image for larger view
The monthly average U.S.-dollar price of West Texas Intermediate (WTI) crude oil edged higher again in September, rising by $0.87 (0.8 percent) to $107.44 per barrel. That price increase coincided with a negligible weakening of the dollar, the lagged impacts of a jump in consumption of 322,000 barrels per day (BPD) to 19.0 million BPD in July (the highest rate of consumption in nearly a year), and a modest decrease in crude stocks.
The impact of de-bottlenecking projects at the Cushing, OK oil storage facility, which was responsible for some of July’s price jump, appears close to being nearly fully priced in. The monthly average price spread between Brent crude (the predominant grade used in Europe) and WTI expanded in August by $1.39, to $4.71 per barrel.
Click image for larger view

Click image for larger view
Futures prices retreated, at least in part because Mid-East tensions seem to have moved off the “front burner.”

Click image for larger view
The foregoing comments represent the general economic views and analysis of Delphi Advisors, and are provided solely for the purpose of information, instruction and discourse. They do not constitute a solicitation or recommendation regarding any investment.

September 2013 Currency Exchange Rates

Click image for larger view
In September the monthly average value of the U.S. dollar depreciated against two of the three major currencies we track: 0.6 percent against Canada’s loonie and 0.3 percent against the euro. However, the dollar appreciated by 1.5 percent relative to the yen. On a trade-weighted index basis, the dollar weakened by 0.2 percent against a basket of 26 currencies. 
Click image for larger view
The foregoing comments represent the general economic views and analysis of Delphi Advisors, and are provided solely for the purpose of information, instruction and discourse. They do not constitute a solicitation or recommendation regarding any investment.