Click image
for larger view

Click image
for larger view
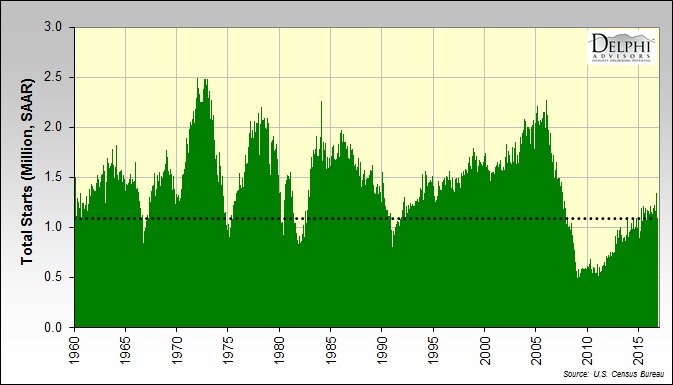
Sales
of new single-family houses in November 2016 were at a seasonally adjusted
annual rate (SAAR) of 592,000 units (580,000 expected).
That was 5.2 percent (±14.1%)* above the revised October rate of 563,000 and 16.5
percent (±19.3%)* above the November 2015 estimate of 508,000 units; the
not-seasonally adjusted year-over-year comparison (shown in the table above)
was +13.9%. For a longer-term perspective, November sales were 57.4% below the “bubble”
peak and 21.6% below the long-term, pre-2000 average.
The
median sales price of new houses sold in November rose to $305,400 (+$2,700 or
0.9%); the average sales price increased by $5,200 (1.5%) to $359,900. Starter
homes (those priced below $200,000) comprised 14.6% of the total sold, up from
November 2015’s record-low 11.1% for that calendar month (going back to 2002);
prior to the Great Recession starter homes represented as much as 61% of total
sales. Homes priced below $150,000 made up 2.4% of those sold in November, a
further slide from November 2015’s previous record-low share of 2.8%.
* 90% confidence interval includes zero.
The Census Bureau does not have sufficient statistical evidence to conclude
that the actual change is different from zero.

Click image
for larger view
As
mentioned in our post
about housing permits, starts and completions in November, single-unit
completions rose by 25,000 units (+3.3%). Because completions and sales were
nearly balanced, new-home inventory expanded in absolute terms (+4,000 units) but
shrank in months of inventory terms (-0.1 month).

Click image for
larger view
Existing home sales
increased by 40,000 units (+0.7%) in November, to 5.61 million units (SAAR), well
above expectations
of 5.35 million. Inventory of existing homes shrank in both absolute (-160,000
units) and months-of-inventory (-0.3 month) terms. Although existing-home sales
outpaced those of new homes in November, the share of total sales comprised of
new homes expanded to 9.5%. The median price of previously owned homes sold in November
edged up by $800 (0.3%), to $234,900.

Click image
for larger view
Housing
affordability marginally improved as the median price of existing homes for
sale in October fell by $3,200 (-1.4%; but +5.9 YoY), to $233,700. Concurrently,
Standard & Poor’s
reported that the U.S. National Index in the S&P Case-Shiller CoreLogic Home
Price indices posted a not-seasonally adjusted monthly change of +0.2% (+5.6% YoY),
bringing home prices to a new all-time high.
“Home
prices and the economy are both enjoying robust numbers,” said David
Blitzer, Managing Director & Chairman of the Index Committee at S&P
Dow Jones Indices. “However, mortgage interest rates rose in November and are
expected to rise further as home prices continue to outpace gains in wages and
personal income. Affordability measures based on median incomes, home prices
and mortgage rates show declines of 20-30% since home prices bottomed in 2012.
With the current high consumer confidence numbers and low unemployment rate,
affordability trends do not suggest an immediate reversal in home price trends.
Nevertheless, home prices cannot rise faster than incomes and inflation indefinitely.”
“After
the S&P CoreLogic Case-Shiller National Index bottomed in February 2012,
its year-over-year growth accelerated to a peak rate of 10.9% in October 2013
and then gradually fell to its current rate of approximately 5%. During the
same period, the highest year-over-year rate from any city was 29% in August
and September 2013; currently the highest single city gain declined to
approximately 11%. Both national and city growth in home prices slowed but
remains above the growth rate of incomes and inflation.”

Click image
for larger view
The foregoing comments represent the
general economic views and analysis of Delphi
Advisors, and are provided solely for the purpose of information, instruction
and discourse. They do not constitute a solicitation or recommendation
regarding any investment.