Click image
for larger version
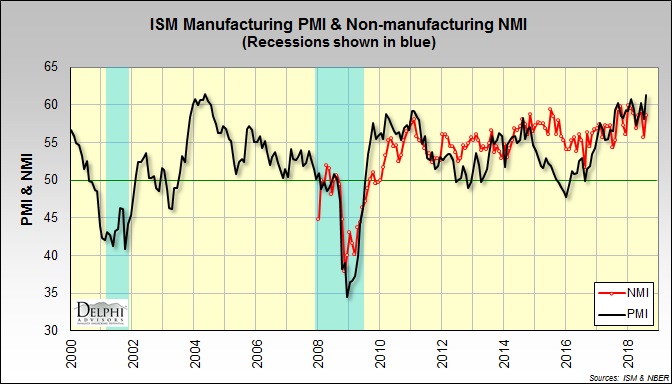
The Institute for
Supply Management’s (ISM) monthly sentiment survey showed that the
expansion in U.S. manufacturing accelerated in August. The PMI
registered 61.3%, down 3.2 percentage
points (PP) from the July reading.
(50% is the breakpoint between contraction
and expansion.) ISM’s
manufacturing survey represents under 10% of U.S. employment and about 20% of
the overall economy. “This indicates strong growth in
manufacturing for the 24th consecutive month, led by continued expansion in all
subindexes that make up the PMI,” said Timothy Fiore, Chair of ISM’s Manufacturing
Business Survey Committee. The only sub-indexes with lower August values
included input prices, exports and imports.
Click image
for larger version
The
pace of growth in the non-manufacturing sector -- which accounts for 80% of the
economy and 90% of employment -- also quickened (+2.8PP) to 58.5%. Only input
prices and imports decelerated.
Click image
for larger version
Of
the industries we track, Wood Products and Ag & Forestry contracted in August.
Respondent comments included the following --
*
Construction: "Tariff-related cost increases are
beginning to accelerate, whether tariffs have been put into effect or not."
*
Real Estate: "Overall, business has increased.
Many factors can be attributed to this increase in demand, [including] the [federal]
budget and positive outlook on the economy."
Relevant
commodities --
* Priced higher: Corrugate; fuel; paper; transportation and trucking services;
freight.
* Priced lower: None.
* Prices mixed: Diesel and lumber.
* In short supply: Construction subcontractors; labor (construction and general);
freight; and truck drivers.
IHS Markit’s
August surveys, although still strong, were not quite as upbeat.
Manufacturing -- August PMI signals strong growth despite dipping
to nine-month low
Key
findings:
* PMI indicates strong improvement in operating conditions
* Rates of output and new order growth ease but remain solid
* Inflationary pressures soften
Services -- Service sector activity growth eases, amid weaker
new business upturn
Key
findings:
* Output and new business expand at softer rates in August
* Employment growth eases to seven-month low
* Inflationary pressures ease
Commentary by Chris Williamson, Markit’s chief business economist --
Manufacturing: "Manufacturers reported the smallest output
rise for almost a year in August, suggesting production growth could be as weak
as 0.2% in the third quarter.
"Exports
remain the key source of weakness for producers, with foreign orders barely
rising in August after two months of modest declines. The strongest growth is
being seen in consumer-facing companies, reflecting robust domestic demand, in turn
linked to the strong labor market and buoyant consumer confidence, though even
here growth has slowed.
"However,
at least some of the slowdown compared to earlier in the year reflects
production being curbed by widespread shortages of inputs, [truckers] and labor,
leading to a further build-up of backlogs of work. For producers of investment
goods such as plant and machinery, order books are backing-up at a rate not
exceeded in over ten years.
"Tariffs
and trade wars were also commonly cited as factors behind companies building
safety stocks of inputs to ensure supply or lock-in lower prices, exacerbating
supply shortages and also driving prices even higher. Looking at the survey
responses, almost two-thirds (64%) of companies reporting higher input prices
explicitly blamed tariffs as the cause of increased costs. Almost one-in-three
went on to cite tariffs as the cause of having to hike prices to customers.
Overall price pressures eased somewhat, however, which if sustained could take
some heat off consumer price inflation in coming months."
Services: “The weaker PMI numbers indicate that the third
quarter is unlikely to see the pace of economic growth match the 4.2% clip seen
in the second quarter, though it’s clear that domestic demand remains strong,
helping companies raise prices at a near-record rate.
“The
survey data so far for the third quarter signal annualized GDP growth of just
under 3.0%. However, further momentum was lost in August, and the weakest rise
in new orders for goods and services for eight months suggests growth could
wane further in September.
“Similarly,
while the survey employment readings remain roughly consistent with a non-farm
payroll gain of just under 200,000, the rate of job creation may likewise start
to slow. Backlogs of work barely rose for a second successive month in August,
indicating that existing operating capacity levels are broadly sufficient to
cope with current demand growth.
“However,
despite the signs of slower growth, companies continued to report strong
pricing power, underscoring the on-going buoyancy of domestic demand in
particular. Average prices charged for goods and services rose at a rate only
slightly below July’s nine-year survey record high.”
The foregoing comments represent the
general economic views and analysis of Delphi Advisors, and are provided solely
for the purpose of information, instruction and discourse. They do not
constitute a solicitation or recommendation regarding any investment.