What is Macro Pulse?

Macro Pulse highlights recent activity and events expected to affect the U.S. economy over the next 24 months. While the review is of the entire U.S. economy its particular focus is on developments affecting the Forest Products industry. Everyone with a stake in any level of the sector can benefit from
Macro Pulse's timely yet in-depth coverage.


Tuesday, July 31, 2018

June 2018 Residential Sales, Inventory and Prices

Click image for larger view 
Click image for larger view
Sales of new single-family houses in June 2018 were at a seasonally adjusted annual rate (SAAR) of 631,000 units (669,000 expected). This is 5.3% (±17.1%)* below the revised May rate of 666,000 (originally 689,000 units), but 2.4% (±24.0%)* above the June 2017 SAAR of 616,000 units; the not-seasonally adjusted year-over-year comparison (shown in the table above) was +1.8%. For longer-term perspectives, not-seasonally adjusted sales were 54.6% below the “housing bubble” peak but 9.0% above the long-term, pre-2000 average.
The median sales price of new houses sold in June was $302,100 (-$7,600 or 2.5% MoM); meanwhile, the average sales price retreated to $363,300 (-$1,800 or 0.5%). Starter homes (defined here as those priced below $200,000) comprised 15.8% of the total sold, up from the year-earlier 12.5%; prior to the Great Recession starter homes represented as much as 61% of total new-home sales. Homes priced below $150,000 made up 3.5% of those sold in June, little changed from 3.6% a year earlier.
* 90% confidence interval includes zero. The Census Bureau does not have sufficient statistical evidence to conclude that the actual change is different from zero. 
Click image for larger view
As mentioned in our post about housing permits, starts and completions in June, single-unit completions fell by 20,000 units (-2.3%). Although the drop in sales (-35,000 units; 5.3%) outpaced that of completions, inventory for sale expanded in both absolute (+4,000 units) and months-of-inventory terms (+0.4 month). 
Click image for larger view
Existing home sales fell by 30,000 units (-0.6%) in June, to a SAAR of 5.38 million units (5.450 million expected). Inventory of existing homes for sale also expanded in absolute and months-of-inventory terms (+80,000 units; +0.2 month). Although new-home sales decreased more slowly than existing-home sales, the share of total sales comprised of new homes ticked down to 10.5%. The median price of previously owned homes sold in June rose to a new record-high $276,900 (+$11,800 or 2.7% MoM). 
Click image for larger view
Housing affordability degraded further as the median price of existing homes for sale in May jumped by $7,700 (+3.0%; +5.2 YoY), to $267,500. Concurrently, Standard & Poor’s reported that the U.S. National Index in the S&P Case-Shiller CoreLogic Home Price indices posted a not-seasonally adjusted monthly change of +1.1% (+6.4% YoY) -- marking a new all-time high for the index.
“Home prices continue to rack up gains two to three times greater than the inflation rate,” said David Blitzer, Managing Director & Chairman of the Index Committee at S&P Dow Jones Indices. “The YoY increases in the S&P CoreLogic Case-Shiller National Index have topped 5% every month since August 2016. Unlike the boom-bust period surrounding the financial crisis, price gains are consistent across the 20 cities tracked in the release; currently, the range of the largest to smallest price change is 10 percentage points (PP) compared to a 20PP range since 2001, and a 25PP range between 2006 and 2009. Not only are prices rising consistently, they are doing so across the country.
“Continuing price increases appear to be affecting other housing statistics. Sales of existing single family homes -- the market covered by the S&P CoreLogic Case-Shiller Indices -- peaked last November and have declined for three months in a row. The number of pending home sales is drifting lower as is the number of existing homes for sale. Sales of new homes are also down and housing starts are flattening. Affordability -- a measure based on income, mortgage rates and home prices -- has gotten consistently worse over the last 18 months. All these indicators suggest that the combination of rising home prices and rising mortgage rates are beginning to affect the housing market.” 
Click image for larger view
The foregoing comments represent the general economic views and analysis of Delphi Advisors, and are provided solely for the purpose of information, instruction and discourse. They do not constitute a solicitation or recommendation regarding any investment.

Friday, July 27, 2018

2Q2018 Gross Domestic Product: First (“Advance”) Estimate

Click image for larger version
In its advance (first) estimate of 2Q2018 gross domestic product (GDP), the Bureau of Economic Analysis (BEA) pegged growth of the U.S. economy at a seasonally adjusted and annualized rate (SAAR) of +4.06% (4.2% expected), up 1.84 percentage points (PP) from 1Q2018’s +2.22%.
On a year-over-year (YoY) basis, which should eliminate any residual seasonality distortions present in quarter-over-quarter (QoQ) comparisons, GDP in 2Q2018 was 2.84% higher than in 2Q2017; that growth rate was slightly faster (+0.26PP) than 1Q2018’s +2.58% relative to 1Q2017.
Three groupings of GDP components -- personal consumption expenditures (PCE), net exports (NetX), and government consumption expenditures (GCE) -- contributed to 2Q growth. Private domestic investment (PDI) detracted from growth to a very minor degree.
The BEA’s real final sales of domestic product growth, which excludes the effect of inventories, was reported to be +5.07%, up by a substantial 3.12PP from 1Q. 
Click image for larger version
This report reflected the BEA’s annual revisions to historical data -- this time, back to 1929 -- and changing the index year from 2009 to 2012. The net effect of those changes boosted estimates of total GDP by an average of 4.9% between 1Q1947 (+$98.5 billion in chained 2012 dollars) and 1Q2018 (+$952.1 billion).
The average QoQ growth rate for the past four quarters was revised materially upward (+1.89PP); from 1Q2008: +1.50PP. Corresponding YoY revisions were comparatively small, however (respectively: -0.1PP and 0.0PP), which demonstrates how annualizing QoQ changes amplifies volatility. Apparently, then, revisions primarily consisted of shifting growth from one quarter to another.
During 2Q2018 the growth rate for total consumer spending was reported to be 2.70%, up 2.34PP from the revised 1Q rate. Inventories subtracted 1.00% from the headline (-1.27PP from 1Q), while the growth rate in commercial fixed investment rose by a nearly offsetting +0.94% (but still 0.40PP below 1Q). Exports added 1.12% (+0.69PP relative to 1Q) to the headline while the subtraction from imports (-0.06%) nearly abated (+0.39PP relative to 1Q). The contribution from government expenditures (+0.37%; +0.10PP from 1Q) was concentrated in defense spending.
“A headline number showing +4.07% growth makes us want to break into a boisterous refrain of Happy Days are Here Again,” wrote Consumer Metric Institute’s Rick Davis, “Some will undoubtedly claim that the Tax Cuts and Jobs Act of 2017 is making America great again. And the BEA's … real final sales growth was reported to be +5.07% -- a number that some might consider to be unsustainably high or an early indication of an overheating economy. At minimum it signals that the Fed's accommodations over the past decade are no longer needed.”
“While we are pleased to find the economy growing far faster than we had previously expected,” Davis concluded, “the historical revisions leave us with a sense of unease.”
The foregoing comments represent the general economic views and analysis of Delphi Advisors, and are provided solely for the purpose of information, instruction and discourse. They do not constitute a solicitation or recommendation regarding any investment.

Thursday, July 19, 2018

June 2018 Residential Permits, Starts and Completions

Click image for larger view 
Click image for larger view
Builders started construction of privately-owned housing units in June at a seasonally adjusted annual rate (SAAR) of 1,173,000 units (1.320 million expected). This is 12.3% (±8.3%) below the revised May estimate of 1,337,000 (originally 1.350 million units) and 4.2% (±10.2%)* below the June 2017 SAAR of 1,225,000 units; the not-seasonally adjusted YoY change (shown in the table above) was -4.1%.
Single-family housing starts in June were at a SAAR of 858,000; this is 9.1% (±8.8%) below the revised May figure of 944,000 (0.0% YoY). Multi-family starts: 315,000 units (-19.8% MoM; -14.8% YoY).
* 90% confidence interval (CI) is not statistically different from zero. The Census Bureau does not publish CIs for the entire multi-unit category. 
Click image for larger view 
Click image for larger view
Completions in June were at a SAAR of 1,261,000 units. This is unchanged (±11.3%)* from the revised May estimate of 1,261,000, but 2.2% (±14.5%)* above the June 2017 SAAR of 1,234,000 units; the NSA comparison: +3.3% YoY.
Single-family housing completions were at a SAAR of 862,000; this is 2.3% (±8.4%)* below the revised May rate of 882,000 (+6.3% YoY). Multi-family completions: 399,000 units (+5.3% MoM; -2.3% YoY). 
Click image for larger view 
Click image for larger view
Total permits in June were at a SAAR of 1,273,000 units (1.333 million expected). This is 2.2% (±1.2%) below the May rate of 1,301,000 (originally 1.301 million units) and 3.0% (±1.1%) below the June 2017 SAAR of 1,312,000 units; the NSA comparison: -8.4% YoY.
Single-family authorizations were at a SAAR of 850,000; this is 0.8% (±1.5%)* above the revised May figure of 843,000 (-0.6% YoY). Multi-family: 423,000 (-7.6% MoM; -21.4% YoY). 
Click image for larger view 
Click image for larger view
Builder confidence in the market for newly-built single-family homes remained unchanged at a solid 68 reading in July on the National Association of Home Builders/Wells Fargo Housing Market Index (HMI). “Consumer demand for single-family homes is holding strong this summer, buoyed by steady job growth, income gains and low unemployment in many parts of the country,” said NAHB Chairman Randy Noel.
“Builders are encouraged by growing housing demand, but they continue to be burdened by rising construction material costs,” said NAHB Chief Economist Robert Dietz. “Builders need to manage these cost increases as they strive to provide competitively priced homes, especially as more first-time home buyers enter the housing market.”
The foregoing comments represent the general economic views and analysis of Delphi Advisors, and are provided solely for the purpose of information, instruction and discourse. They do not constitute a solicitation or recommendation regarding any investment.

Tuesday, July 17, 2018

May 2018 International Trade (Softwood Lumber)

Click image for larger view 
Click image for larger view
Softwood lumber exports extended their decline (5 MMBF or -2.8%) in May, while imports rose (66 MMBF or +4.9%). Exports were 31 MMBF (+23.2%) above year-earlier levels; imports were 146 MMBF (+11.6%) higher. As a result, the year-over-year (YoY) net export deficit was 115 MMBF (10.2%) larger. However, the average net export deficit for the 12 months ending May 2018 was 10.4% smaller than the average of the same months a year earlier (the “YoY MA(12) % Chng” series shown in the graph above). 
Click image for larger view
North America (of which Canada: 23.3%; Mexico: 15.2%) and Asia (especially China: 16.0%) were the primary destinations for U.S. softwood lumber exports in May; the Caribbean ranked third with a 21.6% share. Year-to-date (YTD) exports to China were +46.0% relative to the same months in 2017. Meanwhile, Canada was the source of most (93.4%) of softwood lumber imports into the United States. Imports from Canada are 9.6% lower YTD than the same months in 2017. Overall, YTD exports were up 1.3% compared to 2017, while imports were down 9.3%. 
Click image for larger view 
Click image for larger view
U.S. softwood lumber export activity through the Eastern customs region represented the largest proportion in May (36.0% of the U.S. total), followed by the West Coast (30.0%) and the Gulf (23.8%) regions. However, Seattle maintained its lead (19.5% of the U.S. total) over Mobile (16.1%) and Savannah (15.7%) as the single most-active district. At the same time, Great Lakes customs region handled 66.5% of softwood lumber imports -- most notably the Duluth, MN district (28.5%) -- coming into the United States. 
Click image for larger view 
Click image for larger view
Southern yellow pine comprised 30.0% of all softwood lumber exports in May, Douglas-fir (11.6%) and treated lumber (11.7%). Southern pine exports were up 39.4% YTD relative to 2017, while treated: +2.2%; Doug-fir: -3.4%.
The foregoing comments represent the general economic views and analysis of Delphi Advisors, and are provided solely for the purpose of information, instruction and discourse. They do not constitute a solicitation or recommendation regarding any investment.

June 2018 Industrial Production, Capacity Utilization and Capacity

Click image for larger version
Total industrial production (IP) rose 0.6% in June (+0.6% expected) after declining 0.5% (previously -0.1%) in May. For 2Q2018 as a whole, IP advanced at an annual rate of 6.0%, its third consecutive quarterly increase. Manufacturing output moved up 0.8% in June; also, the production of motor vehicles and parts rebounded after truck assemblies fell sharply in May because of a disruption at a parts supplier. Factory output, aside from motor vehicles and parts, increased 0.3% in June.
The index for mining rose 1.2% and surpassed the level of its previous historical peak (December 2014); the output of utilities moved down 1.5%. At 107.7% of its 2012 average, total IP was 3.8% higher in June than it was a year earlier. 
Click image for larger version 
Click image for larger version
Industry Groups
Manufacturing output moved up 0.8% in June and increased at an annual rate of 1.9% in 2Q, about the same pace as in 1Q. In June, the index for durables advanced 1.6%, while the production of nondurables was little changed. The output of other manufacturing (publishing and logging) declined 0.7%. Within durables, the rebound of about 8% for motor vehicles and parts was accompanied by increases of 1.2% for wood products, and 1.0% or more for computer and electronic products, and for aerospace and miscellaneous transportation equipment. Within nondurable manufacturing, a large drop for apparel and leather and smaller declines for plastics and rubber products and for food, beverage, and tobacco products were offset by gains elsewhere (paper products: 0.0%).
Mining output rose more than 1% in June for its fifth consecutive monthly increase; the index jumped more than 19% at an annual rate in 2Q. Gains in the oil and gas sector continued to support the expansion of the mining sector so far this year. In June, the index for utilities decreased 1.5%, as a loss for electric utilities outweighed a gain for gas utilities. 
Click image for larger version
Capacity utilization (CU) for the industrial sector increased 0.3 percentage point (PP) in June to 78.0%, a rate that is 1.8PP below its long-run (1972–2017) average.
Manufacturing CU rose 0.5PP to 75.5% in June, a rate that is 2.8PP below its long-run average. The operating rate for durables increased about 1PP, and the rate for nondurables was unchanged (wood products: +0.9%; paper products: +0.1%). The utilization rate for mining rose to 92.7%, which is about 6PP higher than its long-run average and about 1PP above its peak in 2014. The rate for utilities moved down 1.3PP and remained well below its long-run average. 
Click image for larger version
Capacity at the all-industries level nudged up 0.2% (+1.5 % YoY) to 138.1% of 2012 output. Manufacturing (NAICS basis) rose fractionally (+0.1% MoM; +1.2% YoY) to 138.0%. Wood products: +0.3% (+2.3% YoY) to 161.1%; paper products: -0.1% (-0.4% YoY) to 110.9%.
Note that estimates for industrial capacity for 2018 were revised for this release. The revisions reflect updated measures of physical capacity from various government and private sources as well as updated estimates of capital spending by industry. Measured from 4Q2017 to 4Q2018, capacity for the industrial sector is now expected to increase 2.0%, a rate that is 0.1PP higher than previously estimated. The increase in capacity for manufacturing is unrevised at 1.3%. Mining capacity is now expected to rise 5.7%. This increase is 0.9PP higher than previously estimated, primarily reflecting faster capacity growth for oil and gas extraction. The gain in capacity for utilities, at 2.0%, is 0.3PP lower than previously estimated.
The foregoing comments represent the general economic views and analysis of Delphi Advisors, and are provided solely for the purpose of information, instruction and discourse. They do not constitute a solicitation or recommendation regarding any investment.

Friday, July 13, 2018

June 2018 Consumer and Producer Price Indices (incl. Forest Products)

Click image for larger version
The Consumer Price Index for All Urban Consumers (CPI-U) increased 0.1% in June (+0.2% expected) after rising 0.2% in May. The indexes for shelter, gasoline, and food all rose to lead to the seasonally adjusted increase in the all items index. The food index increased 0.2% in June, with the indexes for food at home and food away from home both rising 0.2%. Despite a 0.5% increase in the gasoline index, the energy index declined 0.3%, with the indexes for electricity and natural gas both falling.
The index for all items less food and energy rose 0.2% in June. The shelter index rose 0.1%, and the indexes for medical care, used cars and trucks, new vehicles, and recreation all increased. The indexes for apparel, airline fares, and household furnishings and operations all declined in June.
The all items index rose 2.9% for the 12 months ending June; this was the largest 12-month increase since the period ending February 2012. The index for all items less food and energy rose 2.3% for the 12 months ending June. The food index increased 1.4%, and the energy index rose 12.0%, its largest 12-month increase since the period ending February 2017.
The Producer Price Index for final demand (PPI) rose 0.3% in June (+0.2% expected). Final demand prices advanced 0.5% in May and 0.1% in April. In June, most of the rise in the index for final demand is attributable to a 0.4% advance in prices for final demand services. The index for final demand goods edged up 0.1%. Prices for final demand less foods, energy, and trade services moved up 0.3% in June after rising 0.1% in May.
The final demand index moved up 3.4% for the 12 months ended in June, the largest 12-month increase since climbing 3.7% in November 2011; the index for final demand less foods, energy, and trade services climbed 2.7%.
Final Demand
Final demand services: Prices for final demand services moved up 0.4% in June, the largest advance since a 0.5% rise in January. In June, half of the broad-based increase in the index for final demand services can be traced to margins for final demand trade services, which climbed 0.7%. (Trade indexes measure changes in margins received by wholesalers and retailers.) Prices for final demand services less trade, transportation, and warehousing and for final demand transportation and warehousing services rose 0.3% and 0.5%, respectively.
Product detail: Over 40% of the advance in the index for final demand services is attributable to a 21.8% jump in the index for fuels and lubricants retailing. The indexes for hospital outpatient care; health, beauty, and optical goods retailing; truck transportation of freight; automobiles and automobile parts retailing; and food retailing also moved higher. Conversely, prices for apparel, footwear, and accessories retailing declined 2.9%. The indexes for inpatient care and airline passenger services also decreased.
Final demand goods: Prices for final demand goods edged up 0.1% in June following a 1.0% rise in May. Leading the June increase, the index for final demand goods less foods and energy advanced 0.3%. Prices for final demand energy climbed 0.8%. In contrast, the index for final demand foods fell 1.1%.
Product detail: A major factor in the June increase in prices for final demand goods was the index for motor vehicles, which moved up 0.4%. Prices for diesel fuel, electric power, industrial chemicals, and fresh fruits and melons also advanced. Conversely, prices for fresh and dry vegetables dropped 13.8%. The indexes for corn, pharmaceutical preparations, and residential natural gas also moved lower. 
Click image for larger version
All of the not-seasonally adjusted price indexes we track increased on both MoM and YoY bases. 
Click image for larger version
The foregoing comments represent the general economic views and analysis of Delphi Advisors, and are provided solely for the purpose of information, instruction and discourse. They do not constitute a solicitation or recommendation regarding any investment.

Friday, July 6, 2018

June 2018 Employment Report

Click image for larger view
According to the Bureau of Labor Statistics’ (BLS) establishment survey, non-farm payroll employment rose by 213,000 jobs in June -- above expectations of +190,000. In addition, combined April and May employment gains were revised up by 37,000 (April: +16,000; May: +21,000). Meanwhile, the unemployment rate (based upon the BLS’s household survey) advanced to 4.0% because the labor force expanded (+601,000) well in excess of employment gains (+102,000). 
Click image for larger view
Observations from the employment reports include:
* Household and establishment survey results were at least directionally in sync.
* We have often been critical of the BLS’s seeming to “plump” the headline numbers with favorable adjustment factors, but that does not appear to be the case in June. Although imputed jobs from by the CES (business birth/death model) adjustment were slightly above average for the month of June (since 2000), the BLS also applied a far more negative-than-average seasonal adjustment to the base data. Had average June adjustments been used, employment changes might have been roughly +317,000 instead of the reported +213,000.
* As for industry details, Manufacturing expanded by 36,000 jobs. That result is reasonably consistent with the Institute for Supply Management’s (ISM) manufacturing employment sub-index, which expanded in June at a slower pace than in May. Wood Products employment gained 1,300 jobs (ISM was unchanged); Paper and Paper Products: +100 (ISM increased). Construction employment gained 13,000 (ISM increased). 
Click image for larger view
* The number of employment-age persons not in the labor force (NILF) fell by 413,000 (-0.4%), to 95.5 million (but remained within 0.4% of May’s record). Meanwhile, the employment-population ratio was stable at 60.4%; thus, for every five people being added to the population, roughly three are employed. 
Click image for larger view
* The labor force participation rate (LFPR) ticked up to 62.9% -- comparable to levels seen in the late-1970s. Average hourly earnings of all private employees rose by $0.05, to $26.98, resulting in a 2.7% year-over-year increase. For all production and nonsupervisory employees (pictured above), hourly wages advanced by $0.04, to $22.62 (+2.7% YoY). Since the average workweek for all employees on private nonfarm payrolls was unchanged at 34.5 hours, average weekly earnings increased by $1.72 (+0.2%), to $930.81 (+3.4% YoY). With the consumer price index running at an annual rate of 2.8% in May, workers appear -- officially, at least -- to be holding steady in terms of purchasing power. 
Click image for larger view
* Full-time jobs lost ground in June when receding by 89,000. Those employed part time for economic reasons (PTER) -- e.g., slack work or business conditions, or could find only part-time work – dropped by 205,000; non-economic reasons: +209,000. Those holding multiple jobs jumped by 177,000. 
Click image for larger view
For a “sanity check” of the employment numbers, we consult employment withholding taxes published by the U.S. Treasury. Although “noisy” and highly seasonal, the data show the amount withheld decreased in June, by $1.2 billion (-0.6% MoM; -5.1% YoY), to $185.7 billion; it is difficult to conclude anything meaningful from the data beyond observing that the falloff reflects lower withholding rates from the Tax Cuts and Jobs Act of 2017. To reduce some of the volatility and determine broader trends, we average the most recent three months of data and estimate a percentage change from the same months in the previous year. The average of the three months ending June was 2.6% below the year-earlier average -- well off the peak of +13.8% set back in September 2013.
The foregoing comments represent the general economic views and analysis of Delphi Advisors, and are provided solely for the purpose of information, instruction and discourse. They do not constitute a solicitation or recommendation regarding any investment.

Thursday, July 5, 2018

June 2018 Monthly Average Crude Oil Price

Click image for larger view
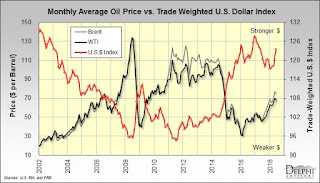
The monthly average U.S.-dollar price of West Texas Intermediate (WTI) crude oil edged lower in June, falling by $2.10 (-3.0%), to $67.87 per barrel. The retreat occurred within an environment of a much stronger U.S. dollar, the lagged impacts of a 632,000 barrel-per-day (BPD) drop in the amount of oil supplied/demanded during April (to 19.9 million BPD), and a gradual decrease in accumulated oil stocks (monthly average: 426 million barrels). 
Click image for larger view 
Click image for larger view
From the 5 July 2018 issue of Peak Oil Review:
In the two weeks since the OPEC+ coalition decided to increase oil production by an undefined amount, oil prices have risen steadily on fears that there will be oil shortages and higher prices in the coming months.  New York oil futures closed above $74 a barrel last week and London closed above $79 on Friday. Driving the markets higher are disruptions to oil production in Venezuela, Libya, Canada, Nigeria, and the US efforts to force Iran to zero exports this fall. The situation is not helped by the slowdown in the increase in US shale oil production due largely to bottlenecks in moving Permian shale oil to markets. There is no sign of a letup in the global demand for oil which is expected to increase by 1.5 million b/d this year.
Taken together, it seems unlikely that Russia and the Gulf Arab states, which are the only countries with significant capacity to increase oil production, will be able to offset the increase in demand and supply disruptions elsewhere. Some observers are even talking about a return to $100 oil next year. The United States aims to reduce Tehran’s oil revenue to zero in an effort to force the Iranian leadership to change its behavior; Washington maintains there is enough spare global oil capacity to make up for lower supply from Iran.
Saudi Arabia is moving to increase production to a record high 11 b/d in July, according to Reuters. If this increase can be realized, it would be an incredibly rapid jump in production by more than 1 million b/d from May levels.  President Trump said in a tweet on Saturday that the Saudis agreed to boost oil production by 2 million b/d. This assertion came as news to the Saudis. The White House quickly walked back the President’s tweet say that “In response to the President’s assessment of a deficit in the oil market, King Salman affirmed that the Kingdom maintains a two million b/d spare capacity, which it will prudently use if and when necessary to ensure market balance and stability.”
Historically, the Saudis have been reluctant to increase oil production to their maximum ability for fear there would be too little a supply buffer should there be more unplanned supply outages. Other gulf Arab countries, as well as Russia, have extra output capacity, but these capacities are far smaller than that of the Saudis.
According to Goldman Sachs an outage at Syncrude Canada’s oil-sands facility may lead to a 360,000 b/d shortage for July and shrink stockpiles at the US storage hub at Cushing, Oklahoma.
The OPEC Production Cut: Oil prices jumped 5 percent the Friday before last after the OPEC+ group announced a vague decision to maintain its collective oil production target while lifting country-specific limits. The result was viewed as only a modest increase, which could lead to tighter supplies. Saudi officials later sought to clarify the decision by noting that the move would lead to an increase of 1 million b/d. That caused prices to fall back a bit on Monday.
OPEC oil output rose last month as Saudi Arabia pumped at a near-record rate, a Reuters survey found on Monday.  The cartel pumped 32.32 million b/d in June, up 320,000 b/d from May.
Saudi Arabia has invited Russia to become an observer member of OPEC.  Russia and Saudi Arabia have increased ties in recent years out of a mutual desire to increase oil prices that underpin their economies. The OPEC /non-OPEC coalition now controls almost half of global crude production.
US Shale Oil Production: US crude production fell marginally by 2,000 b/d to 10.467 million in April from the highest on record in March, the EIA said in a monthly report last Friday.  Baker Hughes reported another dip in the number of active oil and gas rigs in the US. Oil rigs decreased by four last week and the number of gas rigs by one. The pipeline constraints on Permian shale oil production are finally starting to bite, threatening to derail the boom that has been underway for the last few years.  According to Bloomberg Permian drillers are “quitting new wells at a record pace.” The region’s pipeline network is nearly full, forcing steep and ever-widening discounts for the price of oil coming from West Texas. The number of drilled but uncompleted wells remains very high.
Oil production in the Permian is rising by 800,000 b/d annually, with current production at 3.3 million b/d. The total pipeline capacity is 3.6 million b/d, so producers—especially those that don’t have firm deals for pipeline transportation—will be hitting the limit of takeaway capacity in the next three to four months. Significant increases in pipeline capacity are not expected for another 18 months, suggesting that Permian production will plateau at 3.3 million b/d for the next year or so. While production at other shale oil basins continues to grow, nobody is expecting a substantial increase in oil production from these aging shale oil deposits.

Selected highlights from the 29 June 2018 issue of Oil & Energy Insider include:
U.S. dials back hard line on Iran imports. Earlier this week, a State Department official laid out what sounded like a “zero tolerance” policy for nations cutting oil imports from Iran. The official said that countries need to “zero” out their imports by November, and that it would be unlikely anyone would receive a waiver. The statement led to a spike in oil prices because the market had to dramatically revise up the assumed outage from Iran. On Thursday, a State Department official appeared to soften the line. “Our focus is to work with those countries importing Iranian crude oil to get as many of them as possible down to zero by Nov. 4,” the official said Thursday. “We are prepared to work with countries that are reducing their imports on a case-by-case basis. We are serious about our efforts to pressure Iran to change its threatening behavior.” The walking back of the “zero” imports mantra suggests the U.S. fears the fallout of pushing oil prices too high.
India tells refiners to prepare for “zero” imports from Iran. India’s oil minister advised its refiners to prepare for a “drastic reduction or zero” oil imports from Iran by November, due to the threat of U.S. sanctions. India, as a close neighbor and significant purchaser of oil from Iran, appears willing to wind down oil imports from Iran even as it does not recognize the sanctions as legitimate. India’s actions are an indication that Washington could wield far-reaching influence over Iran’s oil exports, even though much of the world is not lined up with the U.S. position.
Saudi Arabia to ramp up production to 10.8-11.0 mb/d. Saudi Arabia reportedly will ramp up oil production to 10.8 mb/d in July, perhaps as high as 11.0 mb/d. The plans come as a series of outages around the world have pushed oil prices and left the market in a deficit. The increase in production, however, could eliminate as much as 40 percent of Saudi Arabia’s spare capacity, taking available capacity down to around 1.5 mb/d, a rather small buffer. “It basically leaves us with no spare capacity, at a time when Iran isn’t the only issue,” Amrita Sen, chief oil analyst at consultant Energy Aspects Ltd., said in a Bloomberg television interview. “Venezuelan production’s falling, Angola, Libya, Nigeria --there are lots and lots of issues everywhere in the world.”
Oil jumps on massive crude draw. The U.S. saw crude inventories plunge by 9.9 million barrels last week, another sign of a tightening oil market. Oil futures jumped more than 3 percent on the news.
The foregoing comments represent the general economic views and analysis of Delphi Advisors, and are provided solely for the purpose of information, instruction and discourse. They do not constitute a solicitation or recommendation regarding any investment.

June 2018 ISM and Markit Surveys

Click image for larger version
The Institute for Supply Management’s (ISM) monthly sentiment survey showed that the expansion in U.S. manufacturing accelerated in June. The PMI registered 60.2%, up 1.5 percentage points (PP) from the May reading. (50% is the breakpoint between contraction and expansion.) ISM’s manufacturing survey represents under 10% of U.S. employment and about 20% of the overall economy. "This indicates strong growth in manufacturing for the 22nd consecutive month, led by continued expansion in new orders, production and employment,” said Timothy Fiore, Chair of ISM’s Manufacturing Business Survey Committee. “However, inventories continue to struggle to maintain expansion levels as a result of supplier deliveries slowing further."
“The price increases across all industry sectors continue,” said Fiore, including metals (all steels, steel components, aluminum and copper), chemicals, corrugate, freight, electronic components, fuels, plastics and wood products. 
Click image for larger version
The pace of growth in the non-manufacturing sector -- which accounts for 80% of the economy and 90% of employment -- also rose further (+0.5PP) to 59.1%. Most sub-indexes exhibited significant changes, although changes overall were mixed. 
Click image for larger version
All of the industries we track except Ag & Forestry expanded in June. Respondent comments included the following --
* Construction: "Tariffs, freight [issues] and labor shortages continue to have an inflationary influence on costs."

Relevant commodities --
* Priced higher: Caustic soda; corrugate and corrugated boxes; oil; diesel; natural gas; paper and paper products; wood pallets; and lumber.
* Priced lower: Gasoline.
* Prices mixed: None.
* In short supply: Construction subcontractors; and labor (construction and temporary).

IHS Markit’s June surveys presented a generally upbeat view.
Manufacturing -- U.S. manufacturing growth remains strong despite hitting four-month low.
Key findings:
* Output expands at slower, but still solid, rate
* New orders increase at softest rate since November 2017
* Suppliers¡¦ delivery times lengthen to the greatest extent in series history
Services -- Business activity growth remains sharp in June.
Key findings:
* Output expansion the second-strongest since April 2015
* Steep, but slower upturn in new orders
* Rate of input price inflation joint-quickest since September 2013

Commenting on the data, Chris Williamson, Markit’s chief business economist said --
Manufacturing: “The PMI for June rounds off the best quarter for manufacturing [in] almost four years, but also fires some warning shots about what lies ahead. As such, the second quarter could represent a peak in the production cycle.
“The survey has a good track record of accurately anticipating changes in the official manufacturing output data, and suggests the goods-producing sector is growing at an annualized rate of around 2.5%.
“On the downside, new orders inflows were the weakest for seven months, with rising domestic demand countered by a drop in export sales for the first time since July of last year. Business optimism about the year ahead also fell to the lowest since January, with survey respondents worried in particular about the potential impact of trade wars and tariffs.
“Tariffs were widely blamed on a further marked rise in input costs, and also linked to worsening supply chain delays -- which hit the highest on record, exacerbating existing tight supply conditions.”

Services: “Another month of solid business activity growth means the second quarter saw the strongest performance from the service sector [in] three years. Coming on the heels of a robust manufacturing expansion in the second quarter, the survey data add to indications that the economy has picked up considerable growth momentum since the first quarter.
“June also saw further impressive job gains, with the manufacturing and services surveys indicating that the last two months have seen business hiring increase at the steepest rate for just over three years. At this level, the survey’s employment indices are historically consistent with a non-farm payroll rise on the order of 230,000.
“On the downside, price pressures remained elevated, and are likely to feed through to higher consumer price inflation in coming months. There are also signs that growth could weaken in the third quarter: business expectations about future growth have pulled back from recent highs, and new order flows have slowed for two successive months. However, all indicators remain at sufficiently high levels to suggest that any slowdown may only be modest.”
The foregoing comments represent the general economic views and analysis of Delphi Advisors, and are provided solely for the purpose of information, instruction and discourse. They do not constitute a solicitation or recommendation regarding any investment.

Tuesday, July 3, 2018

May 2018 Manufacturers’ Shipments, Inventories, and New & Unfilled Orders

Click image for larger view 
Click image for larger view
According to the U.S. Census Bureau, the value of manufactured-goods shipments in May increased $2.8 billion or 0.6% to $496.1 billion. Durable goods shipments increased $0.1 billion or virtually unchanged to $247.1 billion led by machinery. Meanwhile, nondurable goods shipments increased $2.7 billion or 1.1% to $249.0 billion, led by petroleum and coal products. Shipments of wood products jumped by 1.2%; paper: +0.6%. 
Click image for larger view
Inventories increased $1.3 billion or 0.2% to $668.4 billion. The inventories-to-shipments ratio was 1.35, unchanged from April. Inventories of durable goods increased $1.3 billion or 0.3% to $403.3 billion, led by transportation equipment. Nondurable goods inventories increased less than $0.1 billion or virtually unchanged to $265.1 billion, led by chemical products. Inventories of wood products were essentially unchanged; paper: +0.4%. 
Click image for larger view
New orders increased $1.8 billion or 0.4% to $498.2 billion. Excluding transportation, new orders rose by 0.7% (+9.0% YoY). Durable goods orders decreased $0.9 billion or 0.4% to $249.2 billion, led by transportation equipment. New orders for non-defense capital goods excluding aircraft -- a proxy for business investment spending -- decelerated to 0.3% (+7.1% YoY). New orders for nondurable goods increased $2.7 billion or 1.1% to $249.0 billion.
As can be seen in the graph above, real (inflation-adjusted) new orders were essentially flat between early 2012 and mid-2014, recouping on average less than 70% of the losses incurred since the beginning of the Great Recession. The recovery in real new orders is back to just 57% of the ground given up in the Great Recession. 
Click image for larger view
Unfilled durable-goods orders increased $6.2 billion or 0.5% to $1,160.8 billion, led by transportation equipment. The unfilled orders-to-shipments ratio was 6.68, down from 6.73 in April. Real unfilled orders, which had been a good litmus test for sector growth, show a much different picture; in real terms, unfilled orders in June 2014 were back to 97% of their December 2008 peak. Real unfilled orders then jumped to 102% of the prior peak in July 2014, thanks to the largest-ever batch of aircraft orders. Since then, however, real unfilled orders have gradually declined and are only now perhaps beginning to turn higher.
The foregoing comments represent the general economic views and analysis of Delphi Advisors, and are provided solely for the purpose of information, instruction and discourse. They do not constitute a solicitation or recommendation regarding any investment.

Monday, July 2, 2018

June 2018 Currency Exchange Rates

Click image for larger view
In June the monthly average value of the U.S. dollar (USD) appreciated versus Canada’s “loonie” (+2.0%), euro (+1.2%) and yen (+0.3%). On a trade-weighted index basis, the USD gained 1.6% against a basket of 26 currencies. 
Click image for larger view
The foregoing comments represent the general economic views and analysis of Delphi Advisors, and are provided solely for the purpose of information, instruction and discourse. They do not constitute a solicitation or recommendation regarding any investment.