What is Macro Pulse?

Macro Pulse highlights recent activity and events expected to affect the U.S. economy over the next 24 months. While the review is of the entire U.S. economy its particular focus is on developments affecting the Forest Products industry. Everyone with a stake in any level of the sector can benefit from
Macro Pulse's timely yet in-depth coverage.


Wednesday, February 28, 2024

4Q2023 Gross Domestic Product: Second Estimate

Click image for larger version

In its second estimate of 4Q2023 gross domestic product (GDP), the Bureau of Economic Analysis (BEA) revised the growth of the U.S. economy to a seasonally adjusted and annualized rate (SAAR) of +3.21% (+3.3% expected), down 0.06 percentage point (PP) from the “advance” estimate (“4Qv1”) and -1.65PP from 3Q2023.

As with 4Qv1, all four groupings of GDP components -- personal consumption expenditures (PCE), private domestic investment (PDI), Net exports (NetX), and government consumption expenditures (GCE) -- contributed positively to the 4Q percent-change headline. “Compared to 3Q2023, the deceleration in real GDP in 4Q primarily reflected a downturn in private inventory investment and slowdowns in federal government spending, residential fixed investment, and consumer spending,” the BEA wrote, adding, “Imports decelerated.”

Click image for larger version

As for details (billions of chained 2017 dollars; all relative to 4Qv1) --

PCE (+$5.1B):

* Goods (-$7.6B). Spending on durable goods retreated ($7.2B), led by recreational goods and vehicles (-$6.8B). A decline in nondurable goods (-$0.9B) was led by clothing and footwear (-$2.9B).

* Services (+$12.1B). Health care (+$16.5B) dominated the jump in household consumption expenditures (+$16.7B).

PDI (-$12.3B):

* Fixed investment (+$7.3B). Gains were balanced between nonresidential (+$3.4B) -- led by structures (+$6.6B) and intellectual property products (+$4.1B) but partially offset by equipment (-$8.4B) -- and residential investment (+$3.4B).

* Inventories (-$16.4B). Nonfarm inventories (-$14.2B) led the drop in this category.

NetX (-$6.7B):

* Exports (+$0.6B). Goods (+$0.4B) led the upward revision in this category.

* Imports (-$7.3B). Goods (-$4.0B) held a narrow lead over services (-$3.1B). Because imports are a subtraction in the calculation of GDP, the downward revision nudged NetX up relative to 4Qv1.

GCE (+$8.9B):

* Federal (-$0.9B). Nondefense consumption expenditures (+$-1.8B) led this category.

* State and local (+$9.6B). Gross investment (+$9.5B) dominated.

The BEA’s change in real final sales of domestic product -- which ignores inventories -- was revised to +3.49% (+0.28PP from 4Qv1), a level 0.11PP below the 3Q2023 estimate. 

Click image for larger version

“This all points to more domestic demand growth than previously thought and a hotter economy in general,” said James Knightley, chief international economist at ING.

The foregoing comments represent the general economic views and analysis of Delphi Advisors, and are provided solely for the purpose of information, instruction and discourse. They do not constitute a solicitation or recommendation regarding any investment.

Tuesday, February 27, 2024

January 2024 Residential Sales, Inventory and Prices

 
Click image for larger view

Click image for larger view

Sales of new single-family houses in January 2024 were at a seasonally adjusted annual rate (SAAR) of 661,000 units (685,000 expected). This is 1.5% (±19.9%)* above the revised December rate of 651,000 (originally 664,000 units) and 1.8% (±19.4%)* above the January 2023 SAAR of 649,000 units; the not-seasonally adjusted (NSA) year-over-year comparison (shown in the table above) was +3.6%. For longer-term perspectives, NSA sales were 52.4% below the “housing bubble” peak and 9.0% above the long-term, pre-2000 average.

The median sales price of new houses sold in January 2024 was $420,700 (+1.8% MoM, or $7,600). The average sales price was $534,300 (+8.3%, or $40,900). Homes priced at/above $750,000 comprised 14.0% of sales, up from the year-earlier 12.7%.

* 90% confidence interval includes zero. The Census Bureau does not have sufficient statistical evidence to conclude that the actual change is different from zero.

Click image for larger view

As mentioned in our post about housing permits, starts and completions in January, single-unit completions fell by 167,000 units (-16.3%). Sales advanced (10,000 units, or +1.5%), but inventory for sale expanded in absolute terms (+4,000 units) but remained constant in months-of-inventory terms. 

Click image for larger view

Existing home sales rose (120,000 units or +3.1%) in January to a SAAR of 4.00 million units (3.97 million expected). The inventory of existing homes for sale expanded in absolute terms (+20,000 units) but shrank in months-of-inventory terms (-0.1 month). Because new sales advanced at a slower pace than resales, the share of total sales comprised of new homes decreased to 14.2%. The median price of previously owned homes sold in January dipped to $379,100 (-0.6% or $2,300).

Click image for larger view

Housing affordability jumped 7.7 percentage points as the median price of existing homes for sale in December retreated by $5,200 (-1.3% MoM; +4.0% YoY) to $387,000. Concurrently, Standard & Poor’s reported that the U.S. National Index in the S&P Case-Shiller CoreLogic Home Price indices fell to a not-seasonally adjusted monthly change of -0.4% (but +5.5% YoY).

“U.S. home prices faced significant headwinds in the fourth quarter of 2023,” said Brian Luke, Head of Commodities, Real & Digital Assets at S&P Dow Jones Indices. “However, on a seasonally adjusted basis, the S&P Case-Shiller Home Price Indices continued its streak of seven consecutive record highs in 2023. Ten of 20 markets beat prior records, with San Diego registering an 8.9% gain and Las Vegas the fastest rising market in December, after accounting for seasonal impacts.”

“2023 U.S. housing gains haven’t followed such a synchronous pattern since the COVID housing boom. The term ‘a rising tide lifts all boats’ seems appropriate given broad-based performance in the U.S. housing sector. All 20 markets reported yearly gains for the first time this year, with four markets rising over 8%. Portland eked out a positive annual gain after 11 months of declines. Regionally, the Midwest and Northeast both experienced the greatest annual appreciation with 6.7%.”

“Looking back at the year, 2023 appears to have exceeded average annual home price gains over the past 35 years. With trend growth at the national level of 4.7%, a 5.5% return demonstrates solid, steady growth. While we are not experiencing the double-digit gains seen in the previous two years, above-trend growth should be well received considering the rising costs of financing home mortgages. We previously suggested that the surge in home prices during the COVID pandemic could have accelerated home ownership temporarily. The past two years reflect consistent growth slightly above trend, suggesting a more secular shift in home ownership post pandemic. In the short term, meanwhile, we should be able to measure the impact of higher mortgage rates on home prices. Increased financing costs appeared to precipitate home price declines in the fourth quarter, as 15 markets saw lower values compared to September.”

Click image for larger view

The foregoing comments represent the general economic views and analysis of Delphi Advisors, and are provided solely for the purpose of information, instruction and discourse. They do not constitute a solicitation or recommendation regarding any investment.

Friday, February 16, 2024

January 2024 Residential Permits, Starts and Completions

Click image for larger view

Click image for larger view

Builders started construction of privately-owned housing units in January at a seasonally adjusted annual rate (SAAR) of 1,331,000 units (1.470 million expected). This is 14.8% (±10.2%) below the revised December estimate of 1,562,000 (originally 1.460 million units) and 0.7% (±11.7%)* below the January 2023 SAAR of 1,340,000 units; the not-seasonally adjusted YoY change (shown in the table above) was -4.1%.

Single-family housing starts in January were at a SAAR of 1,004,000; this is 4.7% (±11.6%)* below the revised December figure of 1,054,000 units (+18.7% YoY). Multi-family: 327,000 units (-35.6% MoM; -37.2% YoY).

* 90% confidence interval (CI) is not statistically different from zero. The Census Bureau does not publish CIs for the entire multi-unit category.

Click image for larger view

Click image for larger view

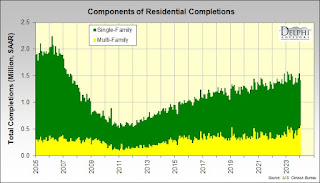
Total completions were at a SAAR of 1,416,000 units. This is 8.1% (±10.0%)* below the revised December estimate of 1,541,000 (originally 1.574 million units), but 2.8% (±14.6%)* above the January 2023 SAAR of 1,377,000 units; the NSA comparison: +1.6% YoY.

Single-family completions were at a SAAR of 857,000; this is 16.3% (±7.9%) below the revised December rate of 1,024,000 units (-17.0% YoY). Multi-family: 559,000 units (+8.1% MoM; +57.1% YoY).

Click image for larger view

Click image for larger view

Total permits were at a SAAR of 1,470,000 units (1.510 million expected). This is 1.5% below the revised December rate of 1,493,000 (originally 1.495 million units) but 8.6% above the January 2023 SAAR of 1,354,000 units; the NSA comparison: +11.6 YoY.

Single-family permits were at a rate of 1,015,000; this is 1.6% above the revised December figure of 999,000 units (+42.0% YoY). Multi-family: 455,000 units (-7.9% MoM; -22.1% YoY).

Click image for larger view

Click image for larger view

Press release from NAHB’s Robert Dietz:

“Expectations that mortgage rates will continue to moderate in the coming months, the prospect of future rate cuts by the Federal Reserve later this year, and a protracted lack of existing inventory helped provide a boost to builder sentiment for the third straight month.

“Builder confidence in the market for newly built single-family homes climbed four points to 48 in February, according to the National Association of Home Builders (NAHB)/Wells Fargo Housing Market Index (HMI). This is the highest level since August 2023.

“Buyer traffic improved at the start of 2024, as even small declines in interest rates produce a disproportionate positive response among likely home purchasers. And while mortgage rates still remain too high for many prospective buyers, we anticipate that due to pent-up demand, many more buyers will enter the marketplace if mortgage rates continue to decline this year.

“With expectations of Fed rate cuts in the latter half of 2024, NAHB is forecasting that single-family starts will rise about 5% this year. But as builders break ground on more homes, lot availability is expected to be a growing concern, along with persistent labor shortages. And as a further reminder that the recovery will be bumpy as buyers remain sensitive to interest rate and construction cost changes, the 10-year Treasury rate is up more than 40 basis points since the beginning of the year.

“With mortgage rates now below 7% since mid-December, more builders are cutting back on reducing home prices to boost sales. In February, 25% of builders reported cutting home prices, down from 31% in January and 36% in the last two months of 2023. However, the average price reduction in February held steady at 6% for the eighth straight month. Meanwhile, the use of sales incentives is also diminishing. The share of builders offering some form of incentive dropped to 58% in February, down from 62% in January and the lowest share since last August.”

The foregoing comments represent the general economic views and analysis of Delphi Advisors, and are provided solely for the purpose of information, instruction and discourse. They do not constitute a solicitation or recommendation regarding any investment.

January 2024 Consumer and Producer Price Indices (incl. Forest Products)

Click image for larger version

Consumer Price Index

The Consumer Price Index for All Urban Consumers (CPI-U) increased 0.3% in January (+0.2% expected), after rising 0.2% in December. Over the last 12 months, the all-items index increased 3.1% before seasonal adjustment.

The index for shelter continued to rise in January, increasing 0.6% and contributing over two thirds of the monthly all-items increase. The food index increased 0.4% in January, as the food at home index increased 0.4% and the food away from home index rose 0.5% over the month. In contrast, the energy index fell 0.9% over the month due in large part to the decline in the gasoline index.

The index for all items less food and energy rose 0.4% in January. Indexes which increased in January include shelter, motor vehicle insurance, and medical care. The index for used cars and trucks and the index for apparel were among those that decreased over the month.

The all-items index rose 3.1% for the 12 months ending January, a smaller increase than the 3.4% increase for the 12 months ending December. The index for all items less food and energy rose 3.9% over the last 12 months, the same increase as for the 12 months ending December. The energy index decreased 4.6% for the 12 months ending January, while the food index increased 2.6% over the last year.


Producer Price Index

The Producer Price Index for final demand increased 0.3% in January (+0.1% expected). Final-demand prices declined 0.1% in December 2023 and advanced 0.1% in November. On an unadjusted basis, the index for final demand rose 0.9% for the 12 months ended January 2024.

In January, the advance in the index for final demand can be traced to a 0.6% rise in prices for final-demand services. In contrast, the index for final-demand goods decreased 0.2%.

The index for final demand less foods, energy, and trade services rose 0.6% in January 2024, the largest advance since moving up 0.6% in January 2023. For the 12 months ended January 2024, prices for final demand less foods, energy, and trade services increased 2.6%.

Final Demand

Final-demand services: The index for final-demand services moved up 0.6% in January, the largest increase since rising 0.8% in July 2023. In January, most of the advance is attributable to prices for final-demand services less trade, transportation, and warehousing, which climbed 0.8%. The index for final-demand trade services moved up 0.2%. (Trade indexes measure changes in margins received by wholesalers and retailers.) Conversely, prices for final-demand transportation and warehousing services fell 0.4%.

Product detail: A 2.2% increase in the index for hospital outpatient care was a major factor in the January rise in prices for final-demand services. The indexes for chemicals and allied products wholesaling, machinery and equipment wholesaling, portfolio management, traveler accommodation services, and legal services also moved higher. In contrast, prices for long-distance motor carrying decreased 1.0%. The indexes for computer hardware, software, and supplies retailing and for engineering services also moved lower.

Final-demand goods: The index for final-demand goods moved down 0.2% in January, the fourth consecutive decline. Most of the January decrease is attributable to a 1.7% drop in prices for final-demand energy. The index for final-demand foods fell 0.3%. Conversely, prices for final-demand goods less foods and energy increased 0.3%.

Product detail: Leading the January decline in the index for final-demand goods, prices for gasoline fell 3.6%. The indexes for electric power; hay, hayseeds, and oilseeds; beef and veal; ethanol; and iron and steel scrap also moved lower. In contrast, prices for communication and related equipment increased 2.4%. The indexes for soft drinks and for liquified petroleum gas also moved higher.

Click image for larger version

The not-seasonally adjusted price indexes we track were all higher on a MoM basis and all lower YoY.

Click image for larger version

The foregoing comments represent the general economic views and analysis of Delphi Advisors, and are provided solely for the purposes of information, instruction and discourse. They do not constitute a solicitation or recommendation regarding any investment.

Thursday, February 15, 2024

January 2024 Industrial Production, Capacity Utilization and Capacity

Click image for larger version

Total industrial production (IP) edged down 0.1% in January (+0.2% expected) after recording no change in December. In January, manufacturing output declined 0.5% and mining output fell 2.3%; winter weather contributed to the declines in both sectors. The index for utilities jumped 6.0%, as demand for heating surged following a move from unusually mild temperatures in December to unusually cold temperatures in January. At 102.6% of its 2017 average, total IP in January was identical to its year-earlier level. 

Click image for larger version

Market Groups

The major market groups posted mixed results in January. The index for consumer goods rose 0.6% with modest gains in its durable and nondurable components. The indexes for business equipment, construction supplies, and business supplies all declined less than 1%; the index for construction supplies was 4.1% below its year-earlier level. Meanwhile, the output of defense and space equipment continued to post solid growth in January and was over 13% above its year-earlier level. Materials output decreased 0.4% in January, as the non-energy component decreased 0.7%, while the energy component edged up 0.1%.

Click image for larger version

Industry Groups

Manufacturing output fell 0.5% in January; the index for durable manufacturing edged up 0.1%, while the index for nondurable manufacturing fell 1.1%. The index for other manufacturing (publishing and logging) moved down 0.2%. Among durables, the largest gains were recorded in electrical equipment, appliances, and components as well as in aerospace and miscellaneous transportation equipment. Computer and electronic products also moved up in January, in part based on the continued strength in semiconductor production. Nonmetallic mineral products and primary metals recorded declines of around 1%; wood products: -0.7%. Declines were widespread among nondurables, with notable weather-related decreases in the indexes of petroleum and coal products, chemicals, and plastics and rubber products; paper: -1.9%.

In January, mining output fell 2.3% amid a weather-related pullback in oil and gas extraction and a drop in coal production. The output of utilities jumped 6.0% as electric and natural gas utilities output increased 4.7 and 13.9%, respectively.

Click image for larger version

Capacity utilization (CU) for the industrial sector moved down 0.2 percentage point (PP) in January to 78.5%, a rate that is 1.1PP below its long-run (1972–2023) average.

Manufacturing CU decreased to 76.6% in January, a rate that is 1.6PP below its long-run average (wood products: -0.8%; paper: -1.9%). The operating rate for mining decreased 2.3PP to 92.2%, a rate that is 5.7PP above its long-run average. The operating rate for utilities moved up 4.0PP to 74.2%, well below its long-run average of 84.4%.

Click image for larger version

Capacity at the all-industries level edged up by 0.1% MoM (+1.4% YoY) to 130.6% of 2017 output. Manufacturing also increased by 0.2% (+1.5% YoY) to 129.6%. Wood products: +0.1% (+0.4% YoY) at 120.2%; paper products: unchanged (-1.0% YoY) at 105.3%.

The foregoing comments represent the general economic views and analysis of Delphi Advisors, and are provided solely for the purpose of information, instruction and discourse. They do not constitute a solicitation or recommendation regarding any investment.

Sunday, February 11, 2024

December 2023 International Trade (Softwood Lumber)

Click image for larger view

With December exports of goods and services at $258.2 billion (+1.5% MoM; +3.2% YoY) and imports at $320.4 billion (+1.3% MoM; -0.4% YoY), the net trade deficit was $62.2 billion (+0.5% MoM; -12.9% YoY). 

Click image for larger view

Click image for larger view

Softwood lumber exports fell (18 MMBF or -16.8%) in December, along with imports (25 MMBF or -2.1%). Exports were 7 MMBF (-7.0%) below year-earlier levels; imports: 30 MMBF (+2.7%) higher. As a result, the year-over-year (YoY) net export deficit was 37 MMBF (+3.6%) higher. Also, the average net export deficit for the 12 months ending December 2023 was 7.1% below the average of the same months a year earlier (the “YoY MA(12) % Chng” series shown in the lumber-trade graph above).

Click image for larger view

North America (55.5% of total softwood lumber exports -- of which Mexico: 36.4%; Canada: 19.1%), Asia (20.3% -- especially India: 6.1%; Japan: 3.7%; China: 3.4%), and the Caribbean (17.3% -- especially the Dominican Republic: 5.1%; Jamaica: 4.0%) were the primary destinations for U.S. softwood lumber exports. Year-to-date (YTD) exports to China were 58.6% higher than the same month of the prior year. Meanwhile, Canada was the source of most (80.5%) softwood lumber imports into the United States. Imports from Canada were 6.6% lower YTD/YTD. Overall, YTD exports were down 1.8% compared to the prior year; imports: -6.6%.

Click image for larger view

Click image for larger view

U.S. softwood lumber export activity through the Gulf customs region represented 35.4% of the U.S. total; West Coast: 31.6%, and Eastern: 23.7%. Mobile (14.0% of the U.S. total), San Diego (15.3%) Laredo (12.8%), and Seattle (12.7%) were the most active districts. At the same time, the Great Lakes customs region handled 56.5% of softwood lumber imports -- most notably the Duluth, MN district (17.4%) -- coming into the United States. 

Click image for larger view

Click image for larger view

Southern yellow pine comprised 23.5% of all softwood lumber exports; Douglas-fir (14.9%), treated lumber (12.6%), other pine (14.4%) and finger-jointed (10.9%) were also significant.

The foregoing comments represent the general economic views and analysis of Delphi Advisors, and are provided solely for the purpose of information, instruction and discourse. They do not constitute a solicitation or recommendation regarding any investment.

Wednesday, February 7, 2024

January 2024 Monthly Average Crude Oil Price

Click image for larger view

The monthly average U.S.-dollar price of West Texas Intermediate (WTI) crude oil edged up by $2.25 (+3.1%) to $74.15/barrel in January. That advance occurred within the context of a marginally stronger U.S. dollar (broad trade-weighted index basis -- goods and services), the lagged impacts of November’s increase of 30,000 barrels per day (b/d) in the amount of petroleum products demanded/supplied (to 20.7 million b/d), and accumulated oil stocks that tipped seasonally lower -- (January 2024 average: 426 million barrels). 

Click image for larger view

Selected highlights from the 02 February 2024 issue of OilPrice.com’s Oil & Energy Insider include:

“Speculation has overshadowed market fundamentals [during the last week of January], with unsubstantiated reports of an impending ceasefire between Israel and Palestine dragging Brent futures below $80 per barrel again,” wrote editor Michael Kern. “On the fundamental side, with OPEC+ rolling over its policy and refusing to change its pre-set course, unforeseen refinery outages in the United States might have an even more lasting impact on prices by weakening US demand even further.”

US Senate Seeks to Overturn Biden’s LNG Pause. The US House of Representatives will seek to overturn the Biden administration’s halt on new LNG project approvals next month, accusing the White House of appeasing radical climate activists, although it is unlikely to get past the Senate.

OPEC+ Sticks to Course, Flags March Meeting. This week’s OPEC+ ministerial meeting made no changes to the oil group’s production policy, with participating top officials indicating they will meet again in early March to decide on an extension of the 2.2 million b/d cuts into Q2.

BP’s Whiting Refinery Shutdown Rattles Midwest. A transformer failure caused a plant-wide power outage at BP’s Whiting refinery in Indiana, forcing the UK oil major to halt all operations at the Midwest’s largest downstream asset, boasting a capacity of 435,000 b/d.

Diverting Tankers Turn to Fast Steaming. Tankers that are diverting around the Cape of Good Hope have been increasingly fast steaming, sailing above normal speeds, to cut back on delivery delays, with container ships sailing at 22 knots, boosting marine fuel demand in Africa further.

Shell Plays Down M&A Pressures. The CEO of Shell Wael Sawan indicated the UK-based oil major is not tempted to join the US shale patch’s acquisition frenzy, whilst its Q4 results surpassed analysts’ expectations at $7.3 billion despite multi-billion impairments.

Qatar Seeks to Expand Oil Output. QatarEnergy awarded service contracts worth $6.2 billion to develop the third phase of its key oil-producing asset, the offshore Al Shaheen field overlying its vast gas reserves in the sea, eyeing a production hike of about 100,000 b/d by 2027-2028.

India to See Coal Power Bonanza in 2024. India will commission an additional 13.9 GW of coal-powered generation capacity this year, marking the highest annual increase since 2019 and more than triple 2023 additions, as last year’s electricity demand surged 11% year-on-year.

Click image for larger view

The foregoing comments represent the general economic views and analysis of Delphi Advisors, and are provided solely for the purpose of information, instruction and discourse. They do not constitute a solicitation or recommendation regarding any investment.

Monday, February 5, 2024

January 2024 Currency Exchange Rates

Click image for larger view

In January, the monthly average value of the U.S. dollar (USD) appreciated against all three currencies we track: Canada’s “loonie” (+0.1%), the euro (+0.1%), and the Japanese yen (+1.6%). On the broad trade-weighted index basis (goods and services) the USD strengthened by 0.3% against a basket of 26 currencies. 

Click image for larger view

The foregoing comments represent the general economic views and analysis of Delphi Advisors, and are provided solely for the purpose of information, instruction and discourse. They do not constitute a solicitation or recommendation regarding any investment.

January 2024 ISM and S&P Global Surveys

Click image for larger version

The Institute for Supply Management‘s (ISM) monthly sentiment survey of U.S. manufacturers reflected a slower rate of contraction in the sector during January. The PMI registered 49.1%, up 2.0 percentage points (PP) from December’s reading. (50% is the breakpoint between contraction and expansion.) ISM’s manufacturing survey represents under 10% of U.S. employment and about 20% of the overall economy. New orders rose (+5.5PP, to 52.5%) along with prices paid (+7.7%, to 52.9%); exports shrank (-4.7PP, to 45.2%) along with customer inventories (-4.4PP, to 43.7%). 

Click image for larger version

Concurrent activity in the services sector -- which accounts for 80% of the economy and 90% of employment -- accelerated (+2.9PP, to 53.4%). Virtually all subindexes turned/stayed above breakeven -- new orders (+2.2PP, to 55.0%) and prices paid (+7.3PP, to 64.0%) perhaps being among the most important.

Click image for larger version

Respondent comments included the following –

Construction. “Transportation impacts of the Suez Canal, due to unrest in the Red Sea and the issues at the Panama Canal are impacting both costs and schedules for the transport of global goods.”


Changes in S&P Global‘s headline index value for manufacturing reflected “an improvement in the health of the U.S. manufacturing sector for the first time since April 2023.” Also, the services sector “signaled a stronger start to the year as business activity expanded at the fastest pace since June 2023.” Details from S&P Global’s surveys follow --

Manufacturing. Strongest improvement in manufacturing performance since September 2022.

Key findings:

  • Renewed rise in new orders
  • Output hampered by supply delays
  • Rate of cost inflation quickens to nine-month high


Services. Business activity growth accelerates to seven-month high in January.

Key findings:

  • Stronger growth in new orders sparks faster upturn in output
  • Selling prices rise at slowest pace in over three-and-a-half years
  • Business confidence at seven-month high


Commentary by Chris Williamson, S&P Global’s chief business economist --

Manufacturing. “Manufacturers have started the year with a spring in their step. Business optimism about the year ahead has surged to its highest since early 2022 thanks to a jump in demand. New orders are rising at a pace not seen for over a year and a half, improving especially sharply for consumer goods as households benefit from signs of an easing in inflation and looser financial conditions.

“Factories are also showing signs of restocking, with some firms buying more inputs to support higher production in the coming months. Payroll numbers are also rising again as firms seek to build extra operating capacity, boding well for the upturn to gain further strength as we head through the first quarter.

“The brighter news is tempered by signs of factory costs rising on the back of supply delays, with costlier deliveries often linked to adverse weather and recent disruptions to global shipping. These higher costs are feeding through to increased prices charged for goods by factories, which rose in January at the fastest pace since last April. Some renewed upward pressure on consumer prices could therefore appear in the months ahead if these supply-linked inflationary trends persist.”


Services. “The U.S. service sector started the year in a sweet spot, with output and demand growth accelerating while price pressures cooled markedly. The key driver of faster growth was the financial services sector, where looser financial conditions tied to expectations of lower interest rates spurred greater activity in January. Households are also benefiting from loosened financial conditions, driving renewed growth in consumer-facing services.

“The buoyancy of the service sector has outweighed a further lackluster performance in manufacturing, and is driving overall output higher at a rate broadly consistent with GDP rising at a 2% pace. With bad weather having curbed some economic activity in January, February should see some further improvement in overall performance.

“Business optimism about growth prospects in the service sector has likewise jumped higher, encouraging further payroll growth, albeit the latter limited by labor shortages.

“Price pressures have meanwhile shifted lower. Overall service sector input cost growth is now running at the second-lowest for over three years, helping pull selling price growth across goods and services down to a level consistent with inflation dropping materially below the Federal Reserve’s 2% target in the near future.”

The foregoing comments represent the general economic views and analysis of Delphi Advisors, and are provided solely for the purpose of information, instruction and discourse. They do not constitute a solicitation or recommendation regarding any investment.

Friday, February 2, 2024

January 2024 Employment Report

Click image for larger view

The Bureau of Labor Statistics’ (BLS) establishment survey showed nonfarm employers adding 353,000 jobs in January -- more than double the +170,000 expected and above even the highest analyst prediction (+300,000). Also, November and December 2023 employment changes were revised up by a combined 126,000 (November: +9,000; December: +117,000 -- from the original +216,000 to the revised +333,000)..

Meanwhile, the unemployment rate (based upon the BLS’s household survey) was unchanged at 3.7%, as a drop in the number of unemployed (-144,000) was essentially matched by a contraction of the labor force (-175,000). 

Click image for larger view

Observations from the employment reports include:

* The establishment survey data were revised as a result of the annual benchmarking process and the updating of seasonal adjustment factors; we observed changes as far back as January 1990. Also, household survey data for January 2024 reflect updated population estimates, which adversely affect the comparability of household data series over time; consequently, comparisons to December 2023 or earlier time periods should be taken with a proverbial “grain of salt.” That said, the two surveys once again diverged widely, which erodes their credibility. While the establishment report showed the addition of 353,000 jobs, the household report indicated the number of employed fell by 31,00.

* Goods-producing industries gained 28,000 jobs; service providers: +325,000. Job gains occurred in professional and business services (+74,000), health care (+70,300), retail trade (+45,200), and social assistance (+30,100). Employment declined in the mining, quarrying, and oil and gas extraction industry (-5,000). Total nonfarm employment (157.7 million) is now nearly 5.4 million jobs above its pre-pandemic level in February 2020 (private sector: +5.17 million; public sector: +224,000). Nonetheless, employment is perhaps 4.7 million below its potential if accounting for growth in the working-age population since January 2006.

Manufacturing added 23,000 jobs (led by nondurable goods: +19,000 -- especially chemical manufacturing: +6,900). That result seems to be at odds with the change in the Institute for Supply Management (ISM) manufacturing employment subindex, which contracted more quickly (to 47.1) in January. Wood products manufacturing shed 900 jobs (ISM was unchanged); paper manufacturing: -1,800 (ISM decreased); construction: +11,000 (ISM not yet published).

Click image for larger view

* The number of employment-age persons not in the labor force fell (-275,000) to 100.3 million (5.0 million above February 2020). Because the working-age civilian population contracted (-175,000) while the number of employed edged lower (-31,000), the employment-population ratio (EPR) inched up to 60.2%, which is 0.9PP below its February 2020 level. 

Click image for larger view

* Also, because the working-age civilian population fell by 451,000 while the labor force shrank by 175,000, the labor force participation rate was unchanged at 62.5%. Average hourly earnings of all private employees nudged up by $0.19 (to $34.55), and the year-over-year increase decelerated to +3.9%. Because the average workweek for all employees on private nonfarm payrolls decreased to 34.1 hours, average weekly earnings fell (-$0.39) to $1,178.16 (+1.2% YoY). With the consumer price index running at an annual rate of +3.4% in December, the average worker likely lost purchasing power. 

Click image for larger view

* Full-time workers ticked lower (-63,000) to 133.1 million; there are now over 2.3 million more full-time jobs than in February 2020. For perspective, however, the non-institutional working-age civilian population has expanded by 7.9 million during that period. Workers employed part time for economic reasons (shown in the graph above) -- e.g., slack work or business conditions, or could find only part-time work -- rose by 211,000, while those working part time for non-economic reasons fell (-302,000). Multiple-job holders: -293,000.

Click image for larger view

For a “sanity test” of the job numbers, we consult employment withholding/FICA taxes published by the U.S. Treasury. Although “noisy” and highly seasonal, the data show the amount withheld in January ticked up by $2.4 billion, to $290.1 billion (+0.8% MoM; +1.7% YoY). To reduce some of the monthly volatility and determine broader trends, we average the most recent three months of data and estimate a percentage change from the same months in the previous year; the average of the three months ending January was down 4.7% from the year-earlier average.

The foregoing comments represent the general economic views and analysis of Delphi Advisors, and are provided solely for the purpose of information, instruction and discourse. They do not constitute a solicitation or recommendation regarding any investment.

December 2023 Manufacturers’ Shipments, Inventories, and New & Unfilled Orders

Click image for larger view

Click image for larger view

According to the U.S. Census Bureau, the value of manufactured-goods shipments in December increased $0.3 billion or virtually unchanged to $581.0 billion. Durable goods shipments decreased $0.9 billion or 0.3% to $282.1 billion, led by transportation equipment. Meanwhile, nondurable goods shipments increased $1.2 billion or 0.4% to $298.9 billion, led by food products. Shipments of wood products decreased 0.3%; paper: +0.3%.

Click image for larger view

Inventories increased $1.0 billion or 0.1% to $857.7 billion. The inventories-to-shipments ratio was 1.48, unchanged from November. Inventories of durable goods increased $1.9 billion or 0.4% to $526.9 billion, led by transportation equipment. Nondurable goods inventories decreased $0.9 billion or 0.3% to $330.8 billion, led by petroleum and coal products. Inventories of wood products shrank by 0.7%; paper: +0.1%.

Click image for larger view

New orders increased $1.2 billion or 0.2% to $594.3 billion. Excluding transportation, new orders rose by $2.2 billion or 0.4% (-0.1% YoY). Durable goods orders decreased less than $0.1 billion or virtually unchanged to $295.4 billion, led by transportation equipment. New orders for non-defense capital goods excluding aircraft -- a proxy for business investment spending -- advanced by $0.1 billion or 0.2% (+0.9% YoY). New orders for nondurable goods increased $1.2 billion or 0.4% to $298.9 billion.

Click image for larger view

Unfilled durable-goods orders increased $18.2 billion or 1.3% to $1,393.2 billion, led by transportation equipment. The unfilled orders-to-shipments ratio was 7.08, up from 6.96 in November. Real (inflation-adjusted) unfilled orders, which -- prior to the pandemic -- had been a good litmus test for potential sector growth, show a more-muted picture; in real terms, unfilled orders in June 2014 were back to 104% of their December 2008 peak. Real unfilled orders then jumped to 110% of the prior peak in February 2015, thanks to the largest-ever batch of aircraft orders. Real unfilled orders trended lower through 2020, but now seem to be exhibiting a quickening trend.

The foregoing comments represent the general economic views and analysis of Delphi Advisors, and are provided solely for the purpose of information, instruction and discourse. They do not constitute a solicitation or recommendation regarding any investment.