What is Macro Pulse?

Macro Pulse highlights recent activity and events expected to affect the U.S. economy over the next 24 months. While the review is of the entire U.S. economy its particular focus is on developments affecting the Forest Products industry. Everyone with a stake in any level of the sector can benefit from
Macro Pulse's timely yet in-depth coverage.


Friday, September 7, 2018

August 2018 Employment Report

Click image for larger view
According to the Bureau of Labor Statistics’ (BLS) establishment survey, non-farm payroll employment rose by 201,000 jobs in August -- slightly above expectations of +198,000. However, combined June and July employment gains were revised down by 50,000 (June: -40,000; July: -10,000). Meanwhile, the unemployment rate (based upon the BLS’s household survey) remained at 3.9% because the drop in the number of employed persons (-423,000) nearly matched the contraction in the labor force (-469,000). 
Click image for larger view
Observations from the employment reports include:
* The household (423,000 fewer people employed) and establishment (+201,000 jobs) survey results were wildly out of sync.
* We have often been critical of the BLS’s seeming to “plump” the headline numbers with favorable adjustment factors; that does not appear to have occurred in August. Although imputed jobs from by the CES (business birth/death model) adjustment were about average for the month of August (since 2000), the BLS also applied a larger (i.e., more negative) than-average seasonal adjustment to the base data. Had average August adjustments been used, employment changes might have been roughly +236,000 instead of the reported +201,000.
* As for industry details, Manufacturing contracted by 3,000 jobs. That result is inconsistent with the Institute for Supply Management’s (ISM) manufacturing employment sub-index, which expanded in August at a faster pace than in July. Wood Products employment lost 800 jobs (ISM was unchanged); Paper and Paper Products: +1,800 (ISM increased). Construction employment added 23,000 (ISM increased). 
Click image for larger view
* The number of employment-age persons not in the labor force (NILF) jumped by 692,000 (+0.7%), to a new record of 96.3 million. Accordingly, the employment-population ratio retreated to 60.3%; thus, for every five people being added to the population, roughly three are employed. 
Click image for larger view
* Similarly, the labor force participation rate (LFPR) fell to 62.7% -- comparable to levels seen in the late-1970s. Average hourly earnings of all private employees rose by $0.10, to $27.16, resulting in a 2.9% year-over-year increase. For all production and nonsupervisory employees (pictured above), hourly wages advanced by $0.07, to $22.73 (+2.8% YoY). Since the average workweek for all employees on private nonfarm payrolls was unchanged at 34.5 hours, average weekly earnings increased by $3.45 (+0.4%), to $937.02 (+3.5% YoY). With the consumer price index running at an annual rate of 2.9% in July, workers may finally be gaining ground -- officially, at least -- in terms of purchasing power. 
Click image for larger view
* Full-time jobs lost ground when retreating by 444,000. Those employed part time for economic reasons (PTER) -- e.g., slack work or business conditions, or could find only part-time work – dropped by 188,000; non-economic reasons: +249,000. Those holding multiple jobs fell by 128,000. 
Click image for larger view
For a “sanity check” of the employment numbers, we consult employment withholding taxes published by the U.S. Treasury. Although “noisy” and highly seasonal, the data show the amount withheld decreased in August, by $1.3 billion (-0.7% MoM; +0.4% YoY), to $191.2 billion; it is difficult to conclude anything meaningful from the data beyond observing that the YoY rise occurred despite lower withholding rates from the Tax Cuts and Jobs Act of 2017. To reduce some of the volatility and determine broader trends, we average the most recent three months of data and estimate a percentage change from the same months in the previous year. The average of the three months ending August was 1.9% below the year-earlier average -- well off the peak of +13.8% set back in September 2013.
The foregoing comments represent the general economic views and analysis of Delphi Advisors, and are provided solely for the purpose of information, instruction and discourse. They do not constitute a solicitation or recommendation regarding any investment.

Thursday, September 6, 2018

August 2018 Monthly Average Crude Oil Price

Click image for larger view
The monthly average U.S.-dollar price of West Texas Intermediate (WTI) crude oil retreated in August, edging down by $2.93 (-4.1%), to $68.06 per barrel. The decrease occurred within the context of a stronger U.S. dollar, the lagged impacts of a 348,000 barrel-per-day (BPD) rise in the amount of oil supplied/demanded during June (to 20.7 million BPD), and relatively stable accumulated oil stocks (monthly average: 407 million barrels). 
Click image for larger view
From the 4 September 2018 issue of Peak Oil Review:
The struggle between the soon-to-be-implemented Iran sanctions and the threat to demand posed by the trade war continues as the primary factor driving [oil] prices.  An unexpectedly large drop in the U.S. crude inventory of 2.6 million barrels last week and a four-unit increase in the US oil rig count last week contributed to the volatility of the market.
Reuters reports that oil analysts cut their price forecasts for 2018 for the first time in almost a year amid growing concern over the impact on crude demand from escalating trade tensions.  Iranian oil exports are already falling rather smartly; however, there is a floor under how far they will fall probably somewhere between 1 and 2 million b/d.  Chinese demand alone will ensure that they do not drop any further.
The U.S.-China trade war, however, does not seem to have a definite end in the immediate future and many are wondering just how much economic damage the standoff will do. There are too many factors, such as the pace of oil production from Venezuela, Libya, and the Permian Basin, to say whether any decline in the global demand for oil will offset looming production problems. 
Click image for larger view
Selected highlights from the 31 August 2018 issue of OilPrice.com’s Oil & Energy Insider include:
Iran complies with nuclear deal, but oil exports falling. The International Atomic Energy Agency said this week that Iran has continued to comply with the terms of the 2015 nuclear deal, despite the withdrawal of the U.S. from the accord. The IAEA said Iran was honoring its commitments to the deal -- specifically, to limit stockpiles of nuclear materials and to grant access to IAEA inspectors. There were no areas in which Iran breached the deal. Nevertheless, the U.S. has stepped up confrontation, having added new demands earlier this year that few expect Iran would ever accept. As such, there is almost no chance of a de-escalation, which means Iran's oil exports are going to continue to fall. The WSJ reports that Iran's exports could fall by as much as 700,000 bpd in August, down to just 1.66 mb/d. By November, exports could dip below 0.8 mb/d.
Texas oil production fell in June. For the first time in 16 months, Texas' oil production fell year-on-year in June. State data finds that Texas' oil production fell to 98.9 million barrels in June, down 2 percent from the same month in 2017 and down 7 percent from the previous month. The sudden drop suggests that pipeline constraints are starting to impact production rates.
OPEC and non-OPEC look to formalize coordination. OPEC and non-OPEC countries are considering ways to formalize their cooperation later this year, eyeing a charter that would extend their coordination on stabilizing the oil market. Under the charter, ministers would meet once a year and technical experts would meet twice a year. The coalition would meet in Vienna and would be hosted by OPEC, but would remain a separate entity.
OPEC production rises despite Iran declines. OPEC production rose to its highest point this year in August, pushed up by a surge in output from Iraq and a restoration of production in Libya. OPEC production increased by 220,000 bpd in August, rising to 32.79 mb/d. Saudi Arabia added a modest 80,000 bpd, taking output up to 10.48 mb/d, after reducing its output in July.
The foregoing comments represent the general economic views and analysis of Delphi Advisors, and are provided solely for the purpose of information, instruction and discourse. They do not constitute a solicitation or recommendation regarding any investment.

August 2018 ISM and Markit Surveys

Click image for larger version
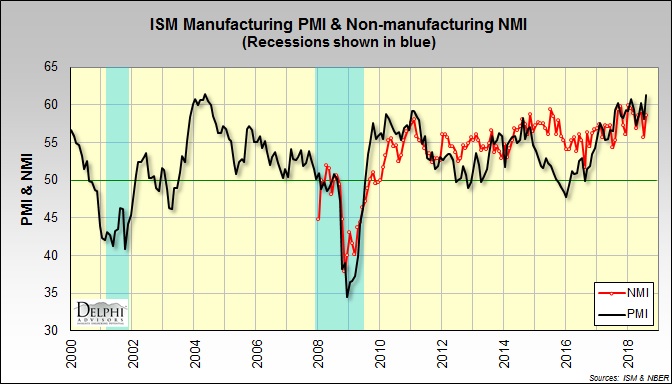
The Institute for Supply Management’s (ISM) monthly sentiment survey showed that the expansion in U.S. manufacturing accelerated in August. The PMI registered 61.3%, down 3.2 percentage points (PP) from the July reading. (50% is the breakpoint between contraction and expansion.) ISM’s manufacturing survey represents under 10% of U.S. employment and about 20% of the overall economy. “This indicates strong growth in manufacturing for the 24th consecutive month, led by continued expansion in all subindexes that make up the PMI,” said Timothy Fiore, Chair of ISM’s Manufacturing Business Survey Committee. The only sub-indexes with lower August values included input prices, exports and imports. 
Click image for larger version
The pace of growth in the non-manufacturing sector -- which accounts for 80% of the economy and 90% of employment -- also quickened (+2.8PP) to 58.5%. Only input prices and imports decelerated. 
Click image for larger version
Of the industries we track, Wood Products and Ag & Forestry contracted in August. Respondent comments included the following --
* Construction: "Tariff-related cost increases are beginning to accelerate, whether tariffs have been put into effect or not."
* Real Estate: "Overall, business has increased. Many factors can be attributed to this increase in demand, [including] the [federal] budget and positive outlook on the economy."
Relevant commodities --
* Priced higher: Corrugate; fuel; paper; transportation and trucking services; freight.
* Priced lower: None.
* Prices mixed: Diesel and lumber.
* In short supply: Construction subcontractors; labor (construction and general); freight; and truck drivers.

IHS Markit’s August surveys, although still strong, were not quite as upbeat.
Manufacturing -- August PMI signals strong growth despite dipping to nine-month low
Key findings:
* PMI indicates strong improvement in operating conditions
* Rates of output and new order growth ease but remain solid
* Inflationary pressures soften
Services -- Service sector activity growth eases, amid weaker new business upturn
Key findings:
* Output and new business expand at softer rates in August
* Employment growth eases to seven-month low
* Inflationary pressures ease

Commentary by Chris Williamson, Markit’s chief business economist --
Manufacturing: "Manufacturers reported the smallest output rise for almost a year in August, suggesting production growth could be as weak as 0.2% in the third quarter.
"Exports remain the key source of weakness for producers, with foreign orders barely rising in August after two months of modest declines. The strongest growth is being seen in consumer-facing companies, reflecting robust domestic demand, in turn linked to the strong labor market and buoyant consumer confidence, though even here growth has slowed.
"However, at least some of the slowdown compared to earlier in the year reflects production being curbed by widespread shortages of inputs, [truckers] and labor, leading to a further build-up of backlogs of work. For producers of investment goods such as plant and machinery, order books are backing-up at a rate not exceeded in over ten years.
"Tariffs and trade wars were also commonly cited as factors behind companies building safety stocks of inputs to ensure supply or lock-in lower prices, exacerbating supply shortages and also driving prices even higher. Looking at the survey responses, almost two-thirds (64%) of companies reporting higher input prices explicitly blamed tariffs as the cause of increased costs. Almost one-in-three went on to cite tariffs as the cause of having to hike prices to customers. Overall price pressures eased somewhat, however, which if sustained could take some heat off consumer price inflation in coming months."

Services: “The weaker PMI numbers indicate that the third quarter is unlikely to see the pace of economic growth match the 4.2% clip seen in the second quarter, though it’s clear that domestic demand remains strong, helping companies raise prices at a near-record rate.
“The survey data so far for the third quarter signal annualized GDP growth of just under 3.0%. However, further momentum was lost in August, and the weakest rise in new orders for goods and services for eight months suggests growth could wane further in September.
“Similarly, while the survey employment readings remain roughly consistent with a non-farm payroll gain of just under 200,000, the rate of job creation may likewise start to slow. Backlogs of work barely rose for a second successive month in August, indicating that existing operating capacity levels are broadly sufficient to cope with current demand growth.
“However, despite the signs of slower growth, companies continued to report strong pricing power, underscoring the on-going buoyancy of domestic demand in particular. Average prices charged for goods and services rose at a rate only slightly below July’s nine-year survey record high.”
The foregoing comments represent the general economic views and analysis of Delphi Advisors, and are provided solely for the purpose of information, instruction and discourse. They do not constitute a solicitation or recommendation regarding any investment.

July 2018 Manufacturers’ Shipments, Inventories, and New & Unfilled Orders

Click image for larger view 
Click image for larger view
According to the U.S. Census Bureau, the value of manufactured-goods shipments in July increased less than $0.1 billion or virtually unchanged to $501.7 billion. Durable goods shipments decreased $0.4 billion or 0.2 percent to $251.1 billion led by transportation equipment. Meanwhile, nondurable goods shipments increased $0.5 billion or 0.2 percent to $250.6 billion, led by petroleum and coal products. Shipments of wood products rose by 0.8%; paper: +0.5%. 
Click image for larger view
Inventories increased $5.6 billion or 0.8 percent to $675.8 billion. The inventories-to-shipments ratio was 1.35, up from 1.34 in June. Inventories of durable goods increased $5.1 billion or 1.3 percent to $408.6 billion, led by transportation equipment. Nondurable goods inventories increased $0.5 billion or 0.2 percent to $267.3 billion, led by petroleum and coal products. Inventories of wood products expanded by 0.3%; paper: +0.6%. 
Click image for larger view
New orders decreased $3.9 billion or 0.8 percent to $497.8 billion. Excluding transportation, new orders rose by 0.2% (+9.8% YoY). Durable goods orders decreased $4.3 billion or 1.7 percent to $247.2 billion, led by transportation equipment. New orders for non-defense capital goods excluding aircraft -- a proxy for business investment spending -- accelerated to +1.6% (+10.3% YoY). New orders for nondurable goods increased $0.5 billion or 0.2 percent to $250.6 billion.
As can be seen in the graph above, real (inflation-adjusted) new orders were essentially flat between early 2012 and mid-2014, recouping on average less than 70% of the losses incurred since the beginning of the Great Recession. The recovery in real new orders is back to just under 57% of the ground given up in the Great Recession. 
Click image for larger view
Unfilled durable-goods orders increased $0.1 billion or virtually unchanged to $1,164.9 billion, led by transportation equipment. The unfilled orders-to-shipments ratio was 6.73, up from 6.64 in June. Real unfilled orders, which had been a good litmus test for sector growth, show a much different picture; in real terms, unfilled orders in June 2014 were back to 97% of their December 2008 peak. Real unfilled orders then jumped to 102% of the prior peak in July 2014, thanks to the largest-ever batch of aircraft orders. Since then, however, real unfilled orders gradually declined and are only now turning higher.
The foregoing comments represent the general economic views and analysis of Delphi Advisors, and are provided solely for the purpose of information, instruction and discourse. They do not constitute a solicitation or recommendation regarding any investment.

Wednesday, September 5, 2018

July 2018 International Trade (Softwood Lumber)

Click image for larger view 
Click image for larger view
Softwood lumber exports extended their decline (6 MMBF or -4.2%) in July, along with by imports (-33 MMBF or -2.3%). Exports were 5 MMBF (-3.5%) below year-earlier levels; imports were 186 MMBF (+15.8%) higher. As a result, the year-over-year (YoY) net export deficit was 191 MMBF (18.3%) larger. However, the average net export deficit for the 12 months ending July 2018 was 4.4% smaller than the average of the same months a year earlier (the “YoY MA(12) % Chng” series shown in the graph above). 
Click image for larger view
North America (of which Canada: 23.0%; Mexico: 17.6%) and Asia (especially China: 15.2%) were the primary destinations for U.S. softwood lumber exports in June; the Caribbean ranked third with a 20.5% share. Year-to-date (YTD) exports to China were +22.6% relative to the same months in 2017. Meanwhile, Canada was the source of most (88.4%) of softwood lumber imports into the United States. Imports from Canada are 3.7% lower YTD than the same months in 2017. Overall, YTD exports were up 10.8% compared to 2017, while imports were down 2.5%.  
Click image for larger view 
Click image for larger view
U.S. softwood lumber export activity through the West Coast customs region represented the largest proportion in July (33.0% of the U.S. total), followed closely by the Eastern region (31.2%) and the Gulf (25.4%) regions. Moreover, Seattle maintained its lead (19.6% of the U.S. total) over Mobile (16.6%) and Savannah (13.0%) as the single most-active district. At the same time, Great Lakes customs region handled 59.8% of softwood lumber imports -- most notably the Duluth, MN district (23.2%) -- coming into the United States. 
 Click image for larger view
Click image for larger view
Southern yellow pine comprised 29.9% of all softwood lumber exports in July, Douglas-fir (13.3%) and treated lumber (9.5%). Southern pine exports were up 16.1% YTD relative to 2017, while treated: -3.6%; Doug-fir: -5.1%.
The foregoing comments represent the general economic views and analysis of Delphi Advisors, and are provided solely for the purpose of information, instruction and discourse. They do not constitute a solicitation or recommendation regarding any investment.
Tuesday, September 4, 2018

August 2018 Currency Exchange Rates

Click image for larger view
In August the monthly average value of the U.S. dollar (USD) depreciated versus Canada’s “loonie” (-0.7%) and yen (-0.5%), but appreciated against the euro (+1.2%). On a trade-weighted index basis, the USD gained 1.0% against a basket of 26 currencies. 
Click image for larger view
The foregoing comments represent the general economic views and analysis of Delphi Advisors, and are provided solely for the purpose of information, instruction and discourse. They do not constitute a solicitation or recommendation regarding any investment.

July 2018 Construction Spending

Click image for larger view
Construction spending during July 2018 was estimated at a seasonally adjusted annual rate (SAAR) of $1,315.4 billion, 0.1% (±1.5%)* above the revised June estimate of $1,314.2 billion (originally $1,317.2 billion); consensus expectations were for +0.4%. The July figure is 5.8% (±1.8%) above the July 2017 SAAR of $1,242.8 billion; the not-seasonally adjusted YoY change (shown in the table below) was +6.5%.
During the first seven months of this year, construction spending amounted to $740.5 billion, 5.2% (±1.2%) above the $703.7 billion for the same period in 2017.
* 90% confidence interval includes zero. The U.S. Census Bureau does not have sufficient statistical evidence to conclude that the actual change is different from zero. 
Click image for larger view
Private Construction
Spending on private construction was at a SAAR of $1,010.9 billion, 0.1% (±0.7%)* below the revised June estimate of $1,011.9 billion.
- Residential: $560.1 billion, 0.6% (±1.3%)* above June’s $556.7 billion.
- Nonresidential: $450.9 billion, 1.0% (±0.7%) below June’s $455.3 billion.
Public Construction
Public construction spending was $304.5 billion, 0.7% (±3.0%)* above the revised June estimate of $302.3 billion.
- Educational: $71.6 billion, 2.1% (±5.9%)* above June’s $70.1 billion.
- Highway: $94.2 billion, 0.4% (±7.1%)* above June’s $93.8 billion. 
Click image for larger view
Click here for a discussion of July’s new residential permits, starts and completions. Click here for a discussion of new and existing home sales, inventories and prices.
The foregoing comments represent the general economic views and analysis of Delphi Advisors, and are provided solely for the purpose of information, instruction and discourse. They do not constitute a solicitation or recommendation regarding any investment.