

Click image
for larger version
Industrial
production (IP) rose 0.4 percent in March after having increased 1.1
percent in February. For 1Q2013 as a whole, output moved up at an annual rate
of 5.0 percent, its largest gain since 1Q2012. At 99.5 percent of its 2007
average, total industrial production in March was 3.5 percent above its
year-earlier level.
Manufacturing output edged down 0.1 percent after
having risen 0.9 percent in February; the index advanced at an annual rate of
5.3 percent in 1Q. Industrial production of Wood Products decreased by 0.5
percent while Paper fell by an even greater 0.9 percent relative to February.
Click image for larger version

Click image for larger version
Click image
for larger version
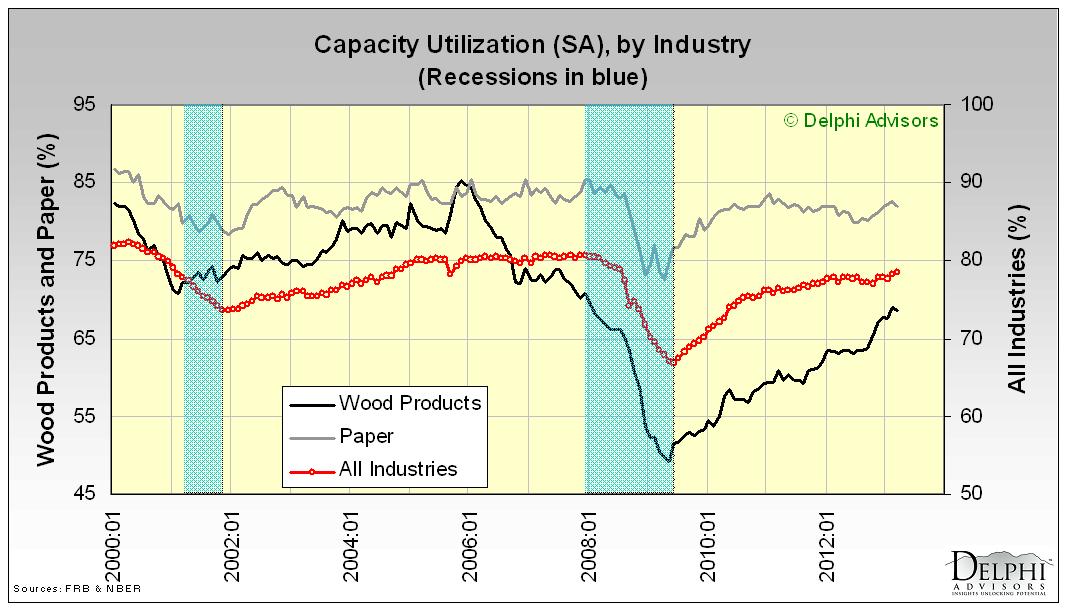
The
rate of capacity utilization for total industry moved up in March to 78.5
percent, a rate 1.2 percentage points above its level of a year earlier but 1.7
percentage points below its long-run (1972-2012) average. Capacity utilization decreased
for both Wood Products and Paper (-0.4 and -0.8 percent, respectively).

Click image
for larger version
Capacity
at the all-industries and manufacturing levels moved higher (0.1 and 0.2
percent, respectively). By contrast, both Wood Products and Paper fell by 0.1
percent.
The
Fed’s IP report was broadly consistent with the Institute
for Supply Management’s March PMI , which registered 51.3 percent, a decrease of 2.9 percentage points
from February (50 percent is the breakpoint between contraction and expansion).
March’s PMI represented the biggest miss to expectations
(of 54.0) in 13 months -- below the lowest estimate, in fact -- driven by a
collapse in new orders.
The
New York Fed’s Empire
State Manufacturing Survey is another contemporary source that is often
useful for comparison (despite the different geographic reach and time frame). The
April
2013 survey suggested that conditions for New York
To
sum up, then, one can cherry pick data to support almost any opinion of the
state of U.S.
The foregoing comments represent the
general economic views and analysis of Delphi Advisors,
and are provided solely for the purpose of information, instruction and
discourse. They do not constitute a solicitation or recommendation regarding
any investment.


No comments:
Post a Comment
Note: Only a member of this blog may post a comment.